M8.C2: Reading Affiliate Dashboard Metrics
Every affiliate platform, such as Amazon Associates, Awin, Impact, CJ, or any other network, offers an affiliate dashboard filled with numbers, graphs, and charts.
At first glance, it can feel like you’re staring at an airplane cockpit with dials you’re not sure how to read.
Clicks, EPCs, CR, AOV, it’s easy to get lost in the acronyms and columns.
But hidden in that data is a real story about how your content is performing and how much value you’re truly generating.
When you know how to read that story, you stop guessing and start managing your affiliate business like a strategist.
Affiliate dashboards are where you see the results of your efforts in near real-time. But data is only useful when you know how to interpret it.
Are low clicks the problem, or is it a weak conversion rate? Is one product doing great while another is silently underperforming?
By learning how to interpret the right metrics, like click-through rate, earnings per click, and conversion rate, you gain clarity on where your money is coming from and what’s slowing it down.
This chapter will walk you through the most common affiliate metrics, explain what they actually mean, and show you how to use them to guide your strategy.
Disclosure: Some of the links I share might be affiliate links. If you click on one and make a purchase, I may earn a small commission as a thank you. But don’t worry, it won’t cost you anything extra. I only recommend stuff I genuinely believe in. Your support helps me keep creating awesome content. You can read my full affiliate disclosure in my disclaimer page.
If you want to save a lot of hours searching for high-paying affiliate programs, check out our exclusive list of 2500+ affiliate programs. You’ll find all the information about the programs inside the list. This list is perfect for affiliate bloggers and influencers.
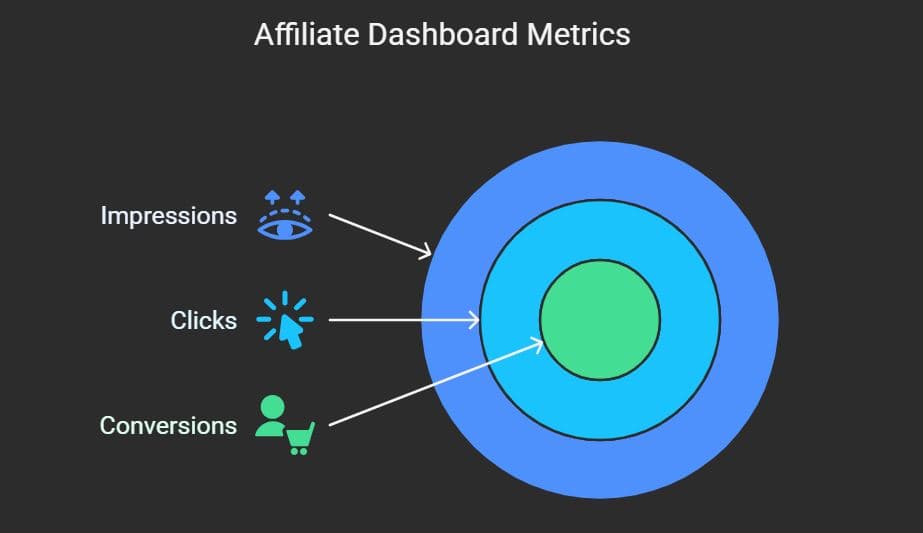
Core Metrics: Clicks, Impressions, And Conversions
The foundation of any affiliate dashboard lies in three simple yet powerful numbers: impressions, clicks, and conversions.
These are the starting points that tell you how much attention your content is getting, how many people are engaging with your affiliate links, and how many are actually making a purchase or completing an action that results in a commission.
Impressions refer to how often your affiliate links or banners are displayed. This number reflects visibility.
You might get thousands of impressions, but if nobody clicks, something is not connecting with the audience.
The click number is where things get more meaningful.
It shows how many people were intrigued enough by your content or recommendation to take action and visit the product page.
A high number of clicks means your call to action is working or your content is well-placed.
Then comes the conversion count. This is the number of people who not only clicked but followed through and completed the purchase or filled out a form.
This is where your revenue comes from.
If your impressions and clicks are solid, but conversions are lagging, you may need to reevaluate the landing page, the product match, or your audience’s intent.
Understanding how these three numbers relate to each other helps you identify the weakest link in your funnel.
Why EPC Matters More Than Total Earnings
Earnings per click, often abbreviated as EPC, is one of the most insightful metrics you can track.
It tells you how much money you’re making on average for every click sent to an affiliate offer.
Instead of just staring at your total commissions and celebrating a big payout, EPC invites you to dig deeper and assess efficiency.
Imagine two blog posts. One earns you fifty dollars from five hundred clicks. The other brings in forty dollars from only one hundred clicks.
Although the first post made more money, the second is actually performing better in terms of EPC. It’s producing more earnings with less effort and traffic.
This type of insight helps you prioritize what content deserves more promotion, more backlinks, or more email traffic.
Tracking EPC across different products, campaigns, or platforms allows you to find your strongest performers.
It helps you avoid wasting time on low-performing offers and instead focus your energy where you get the best return.
EPC is like a performance compass that quietly points you toward smarter, leaner affiliate growth.
What’s A Good CR And How To Improve It
Conversion rate is the percentage of people who clicked your affiliate link and then completed the action needed to earn you a commission.
For example, if you send one hundred clicks and make five sales, your conversion rate is five percent.
This single number is a reflection of both your targeting and how well the offer resonates with your audience.
A high conversion rate usually means your content is attracting the right type of visitor and setting the right expectations.
If you’re reviewing a product and explaining exactly what users can expect, the people who click through are likely already interested and ready to buy.
On the other hand, if your content is too general or vague, your clickers might bounce off the sales page because it’s not aligned with what they expected.
Improving your conversion rate starts with refining your content. Be clear, be honest, and match the reader’s intent to the product you’re recommending.
Keep an eye on which types of posts convert best. Product comparisons and tutorials often outperform listicles and news-style content because they show the value upfront.
Over time, even small tweaks to how you write or where you place your links can lead to better conversion rates and more consistent revenue.
Average Order Value In Long Term Earnings
Average order value tells you how much people are spending when they complete a purchase through your affiliate link.
It may seem like a metric reserved for store owners, but affiliates benefit from understanding it too.
The higher the average order value, the more money you make with the same number of sales.
If you’re promoting a software tool that costs one hundred dollars a year and another that sells for ten dollars per month, the yearly plan might deliver bigger commissions, even with fewer sales.
By paying attention to order value, you can start identifying offers that yield more income for less traffic.
Another way to look at average order value is through content types.
If your review article is sending people to the most basic plan, maybe there’s an opportunity to showcase the premium version and explain its advantages.
The goal is to nudge people toward more valuable purchases by helping them see the benefits clearly.
Higher-order values often come from better education and stronger alignment between content and user needs.
Return Visitors And Lifetime Value Insights
Some affiliate programs offer recurring commissions or track users over long periods. These types of offers can generate revenue long after the initial click.
When reading your affiliate metrics, it’s important to notice whether your dashboard shows return customers or rebill sales.
These indicate that your content has long-term influence.
Return visitors are people who click through, explore, leave, and then come back later to make a purchase.
Many affiliate platforms use cookies or tracking windows to still credit you for that sale.
Knowing this helps you understand that content doesn’t have to lead to an instant conversion to be valuable. Sometimes, your role is to educate and plant the seed.
Rebill offers are common with software, subscriptions, and membership programs.
If a user signs up once and stays for months, you continue to earn commissions each billing cycle. This type of lifetime value is incredibly powerful.
Instead of chasing fresh clicks every day, you build up a base of recurring income.
Learning which offers have this potential helps you build a more sustainable affiliate income stream.
Using SubIDs And Tracking Tags
Affiliate dashboards often allow you to add SubIDs or tracking tags to your links. These little extras are your keys to detailed performance insights.
Instead of wondering where a conversion came from, you can pinpoint it to a single blog post, email campaign, or even a specific button on your page.
Using SubIDs lets you separate traffic sources without needing fancy tools.
You can add a tag like blogpostA or newsletterJune to your link, and when a conversion happens, you’ll know exactly where the buyer came from.
This is incredibly useful when you’re testing different headlines, formats, or placements. You stop guessing and start seeing patterns.
Tracking tags also help you evaluate guest posts, social media efforts, or collaborations with other sites.
Once you get in the habit of using them, your dashboard becomes less of a mystery and more of a feedback loop.
Each SubID tells a story and gives you the data you need to make data-driven decisions.
Spotting Trends And Seasonal Patterns
Affiliate performance is rarely consistent every day of the year.
Sales may spike during certain months, drop in others, or follow patterns tied to product cycles.
When you start reviewing your dashboard with a long-term lens, these trends become easier to see. Understanding them helps you plan content more strategically.
For example, tech gadgets might do better in the months leading up to the holiday season. Travel gear may spike in early summer.
Courses or software tools might perform better at the beginning of the year when people are setting goals.
These seasonal surges are goldmines if you prepare for them in advance.
Looking back at historical data helps you anticipate these cycles.
You can schedule related posts, send more emails, or refresh top-performing articles before the spike hits.
This kind of planning turns you into a proactive affiliate, rather than one who reacts too late to capture the full wave of traffic and sales.
Weekly Data Review For Consistent Growth
Reading your affiliate dashboard once a month is like checking your speed after driving for miles.
By the time you realize something’s wrong, you’ve already missed opportunities.
Instead, make it a habit to review your metrics once a week. This small change can lead to big results.
A weekly review helps you stay on top of trends, catch errors quickly, and stay aligned with your goals.
You can look at which posts are gaining traction, which products are slowing down, and how your overall earnings compare week to week.
It’s less about being obsessed with numbers and more about staying informed.
As you build this routine, you’ll start to see the dashboard as your command center. It’s where strategy meets action.
With consistent review, you’ll catch underperforming links, spot rising stars, and make data-driven decisions with confidence.
Over time, this habit becomes one of the most important tools in your affiliate business toolkit.
What’s Next?
As you become more comfortable reading your dashboard metrics, a new challenge comes into focus: understanding how users interact with your content across time and platforms.
In the next chapter, we’ll take things a step further by diving into attribution models and multi-touch analysis.
You’ll learn how to trace conversions that happen days or even weeks after the first click, and how to credit the right pieces of your funnel for their role in making the sale.
This will help you optimize not just your traffic, but the full journey from first touch to final conversion.