Databox Review (2026): From Messy Spreadsheets to Clear Answers
Running a business means staring at numbers all day. Sales numbers, ad spend, website traffic, and a dozen other metrics scattered across different tools.
Most business owners end up copying and pasting data into spreadsheets just to get a clear picture, and honestly, that gets old fast.
Databox showed up to fix exactly that problem.
It's a business analytics platform that pulls data from over 130 tools like Google Analytics, HubSpot, Shopify, and QuickBooks, then turns it all into clean dashboards and reports you can actually understand at a glance.
No more digging through five different apps just to answer a simple question about how your business is doing.
More than 20,000 businesses already use Databox to track their performance, and the platform has racked up some solid awards along the way, including recognition from G2 for being a high performer.
So the question is simple. Does Databox actually live in up to the hype, or is it just another analytics tool promising more than it delivers?
I spent time testing Databox from top to bottom, and in this review I'll walk you through everything.
The features, the pricing, who it's really built for, and whether it deserves a spot in your business toolkit. Let's get into it.
Disclosure: Some of the links I share might be affiliate links. If you click on one and make a purchase, I may earn a small commission as a thank you. But don’t worry, it won’t cost you anything extra. I only recommend stuff I genuinely believe in. Your support helps me keep creating awesome content. You can read my full affiliate disclosure in my disclaimer page.
Databox Features
1. Genie: Your AI Analyst
Let's talk about Genie first, because it might be the coolest part of Databox. Getting answers from your business data used to take forever.
You'd wait on another team, dig through reports, or build something manually just to answer a simple question. Genie changes that whole process.
It works like a personal data analyst who never sleeps and never makes you wait for a meeting to get scheduled.
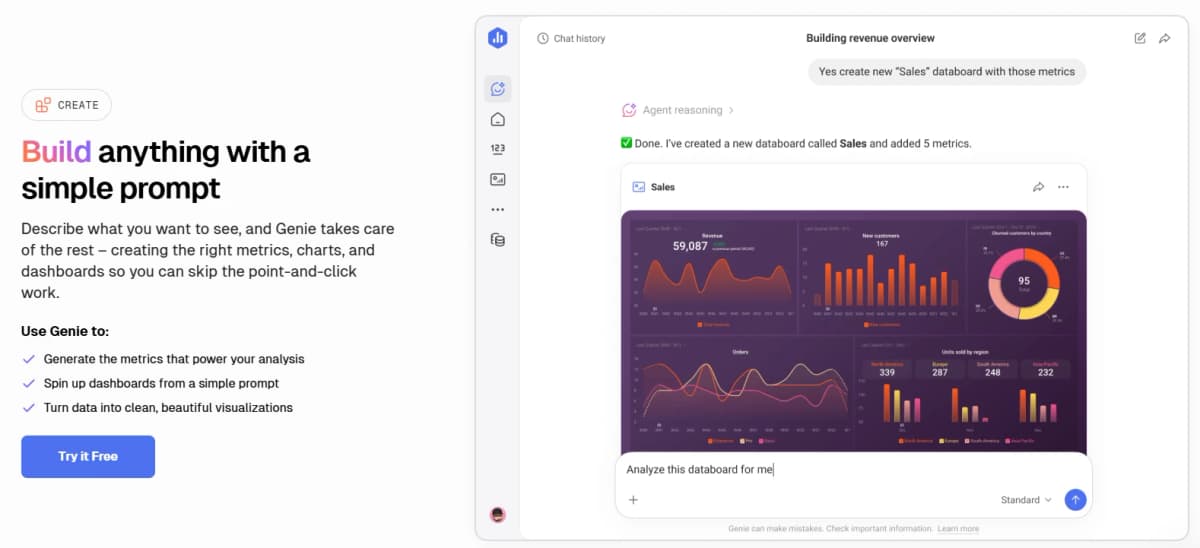
Here's how it works in practice. You type out what you want to see in plain English, and Genie builds it for you. Need a new metric? Just ask.
Want a dashboard pulled together in seconds? Genie handles the setup so you skip all the clicking and dragging that usually eats up your afternoon.
It builds the metrics, the charts, and the dashboards based on your prompt, so you get results instead of busywork.
Genie also does something most tools skip entirely. It explains your numbers to you.
Instead of staring at a chart wondering why sales dropped last week, Genie looks at the data, spots the pattern, and tells you in plain language what is actually going on.
It points out meaningful changes, explains what might be driving them, and gives you recommendations you can act on right away.
That kind of clarity usually takes hours of digging, and Genie gets you there in seconds.
The last piece is what makes Genie feel personal instead of generic. You can teach it how your business actually runs.
Share your goals, your priorities, and how you define success, and Genie remembers all of it.
Every insight going forward gets shaped around your specific KPIs instead of some generic template.
Once you set that context, every answer feels like it came from someone who actually knows your company, not a random tool spitting out numbers.
2. Metrics and KPIs
Every business tracks numbers, but most people struggle to keep them organized in one place.
Databox solves this with a metrics and KPI system built to keep your most important numbers front and center.
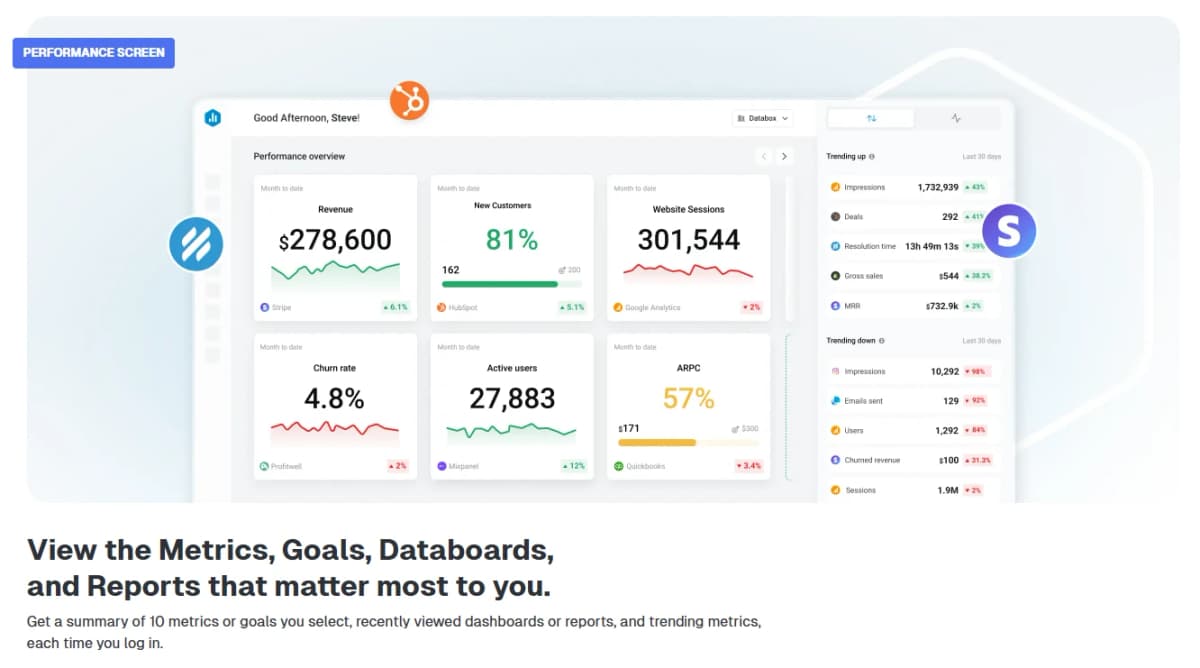
Every time you log in, you get a quick summary of the ten metrics or goals you care about most, along with your recently viewed dashboards and reports.
You also see which metrics are trending, so nothing important slips past you.
Building out your metrics is surprisingly simple too. Databox gives you access to thousands of pre-built metrics pulled from over 130 integrations.
You search for what you need, connect your account, and start tracking almost instantly. For teams working with databases, Databox even includes a no-code SQL builder.
You can pull metrics straight from your SQL sources without writing a single line of code, which means your whole team can dig into database data without needing a developer standing by.
Custom metrics are where things get really flexible. You can save a metric exactly the way you need it, complete with filters, segments, and multiple dimensions, then explore it from different angles later without rebuilding it every time.
If your KPI depends on combining data from more than one source, Databox handles that too.
You can build calculated metrics like conversion rate, ROI, or ROAS by combining numbers from different tools into one equation.
Databox also throws in a few extras that save serious time. Scorecards give you quick updates on fifteen metrics daily, weekly, or monthly, depending on your preference.
Metric Digest sends detailed weekly reports straight to your inbox so you never lose track of performance.
And Alerts keep watch on your data in the background, tapping you on the shoulder the moment something unusual starts trending.
Add in the AI generated performance summaries, and answering the question of how your business is doing takes seconds instead of a full afternoon of digging.
3. Dashboards
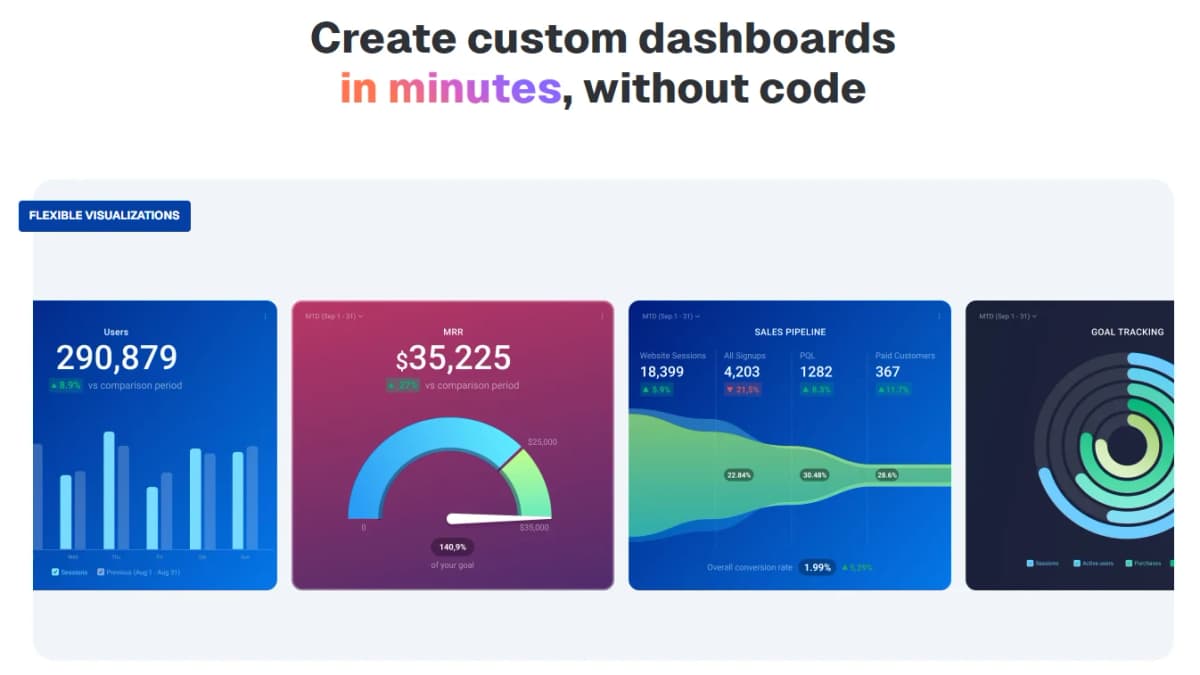
Dashboards are where Databox really shows off. You can build a custom dashboard in minutes without touching a single line of code.
The platform gives you a wide range of visualization options so you can pick the layout that actually makes your data easy to understand.
A good dashboard should let you spot trends at a glance, and Databox seems built with exactly that goal in mind.
Customization goes deeper than most tools offer. You can add your own colors, your logo, and background images to match your brand completely.
If you're an agency sharing dashboards with clients, you can white label the whole thing so it looks like your own product.
Once your dashboard is built, the AI powered summaries kick in automatically, giving viewers a quick explanation of how performance has shifted and what might be worth improving.
You can also filter and segment your data with a single click, and click into any metric to see the exact row level data sitting behind it.
If you need to compare performance across several time periods, that option is built in too, so deeper analysis does not require extra spreadsheets on the side.
Databox also throws in features you rarely see elsewhere. There's a mobile app so you can check performance from anywhere.
One standout feature is the ability to stream a dashboard straight to a TV screen, which is perfect for keeping your team updated in real time or impressing a client during a meeting.
Dashboard Loops let you group two or more dashboards together, so if you're running SEO, ads, and brand campaigns at once, you can loop them into a single rotating view instead of switching tabs constantly.
Security and organization get plenty of attention too. Databox includes Force SSO, two factor authentication, and advanced password protection to keep your data locked down.
You can schedule automatic snapshots sent through email or Slack, add annotations to explain spikes or dips on specific dates, and control permissions so dashboards stay private, shared with select people, or fully public depending on your needs.
And if building from scratch sounds like a hassle, Databox offers ready made templates for platforms like Facebook Ads, Google Ads, Instagram, LinkedIn, and HubSpot CRM, so you can get a working dashboard live with a single click.
4. Reports
Nobody enjoys spending their afternoon copying screenshots into a slide deck. Databox built its Reports feature to end that routine for good.
You can share a full written summary of your performance so stakeholders can read through it on their own schedule before hopping on a call to discuss next steps.
If you prefer presenting live, you can flip your report into presentation mode complete with speaker notes and a full screen view, so walking your team through the numbers feels smooth instead of scrambled.
The layout stays flexible too, since you can arrange your data using set slide types, rows, and columns to match exactly how you want the story told.
Once your report is built, you barely have to touch it again. Databox lets you automate the entire sending process, delivering PDF reports straight to email or Slack on whatever schedule you set.
That alone saves hours every month for anyone who used to send these updates by hand.
The Data Stories feature takes things further by letting you add dynamic elements like metrics, time periods, and percentage changes directly into your written text, so the report reads like an actual story about your performance instead of a wall of numbers.
On top of that, AI generated summaries break down your key metrics automatically, giving readers the context they need without forcing them to interpret every chart themselves.
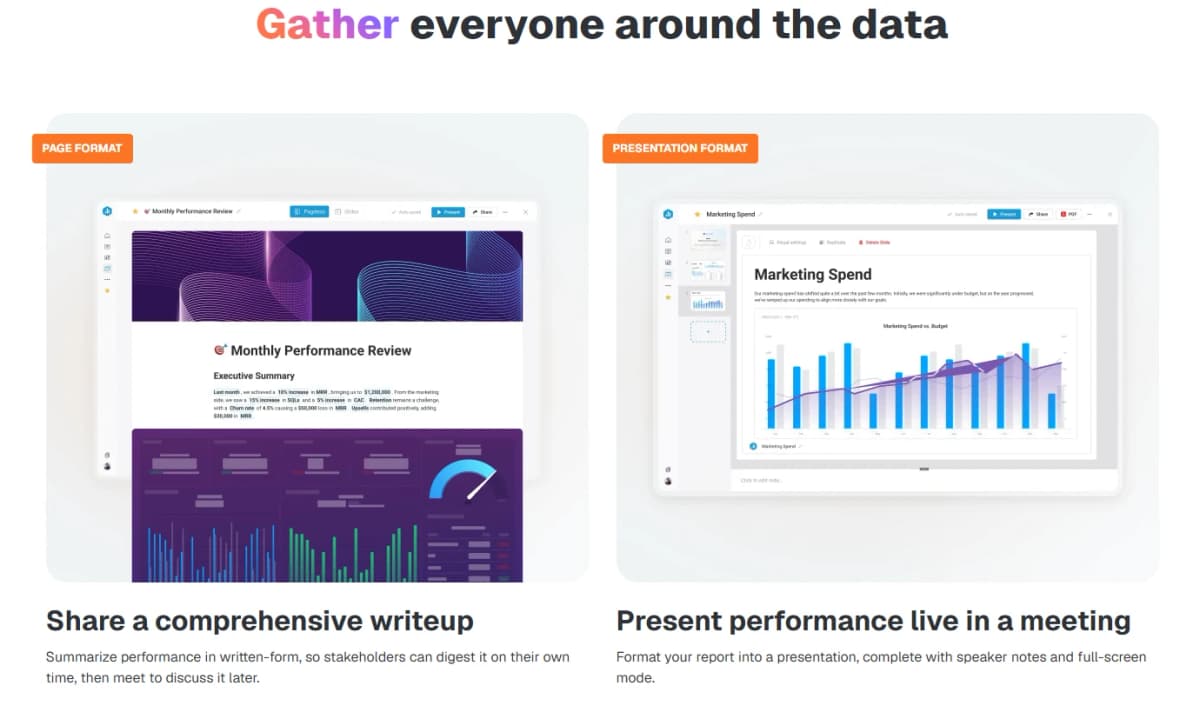
Visuals matter just as much as the writing, and Databox handles that side well too.
You can embed your existing dashboards, metrics, and goals directly into a report, which helps readers actually picture how performance looks instead of just reading about it.
Styling stays fully customizable, so you can adjust fonts, add your logo, and match your company branding throughout the entire report.
That branding consistency matters a lot if you are sending these reports to clients or executives who expect something polished.
A few smaller features round out the experience nicely. You can archive old reports and pull them up anytime you need to reference past performance.
Speaker notes let you add extra context below any slide for when you are presenting live.
And if building from scratch feels like a lot of work, Databox offers ready made templates for things like Google Analytics 4, Facebook Ads, Google Ads, social media performance, and even financial reporting pulled straight from QuickBooks.
These templates make it easy to get a professional looking report running within minutes instead of starting from a blank page.
5. Goals
Setting goals is easy. Setting goals that actually make sense based on your real numbers is a different story.
Databox handles this by letting you build goals around historical data, so what you are aiming for actually reflects what your business is capable of instead of a random guess.
You can track every team's goals in one central place, which keeps everyone working from the same information instead of chasing separate spreadsheets.
Creating a goal takes just a few clicks. You can set a target for any metric you are already tracking, including custom metrics you built yourself.
Once your goal is live, Databox gives you several ways to watch your progress in real time, including gauge charts, progress bars, tables, and simple number blocks.
If something starts drifting off track, alerts let you know within the first few days of the month instead of leaving you to figure it out halfway through, which gives you actual time to fix course before it becomes a bigger problem.
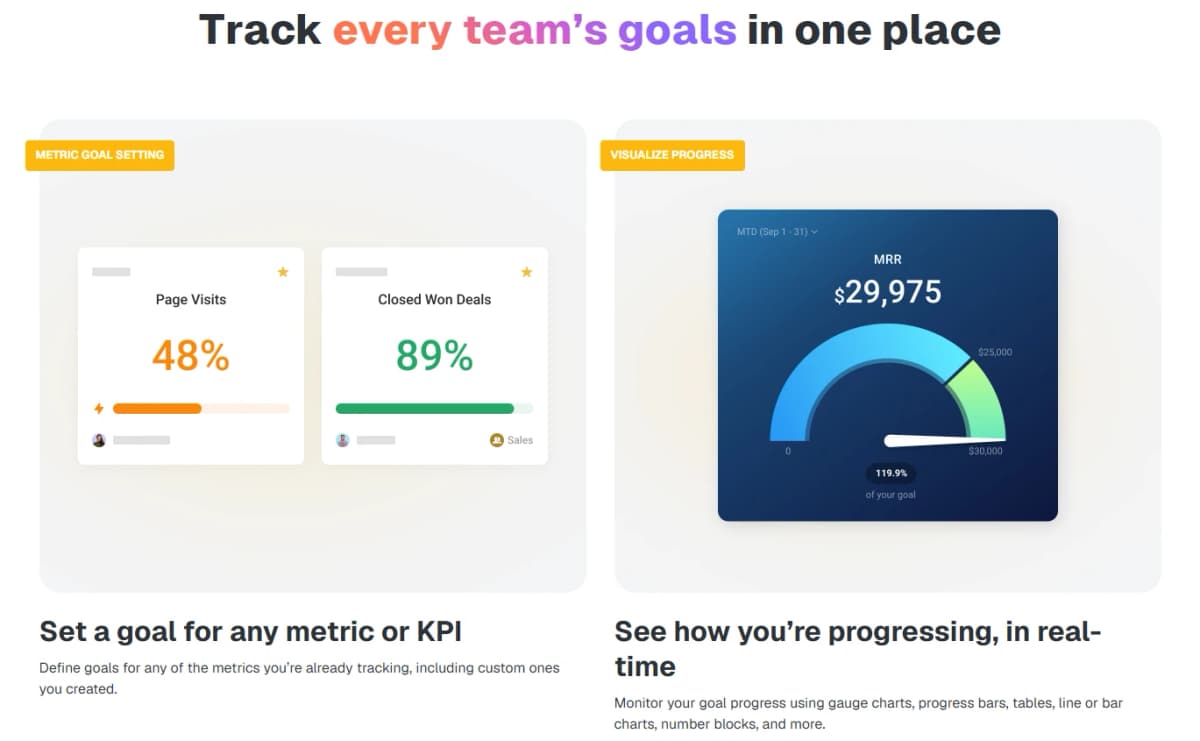
Staying updated does not require you to log in and check constantly either.
Scorecards send automatic updates straight to Slack, email, or the mobile app, covering up to fifteen metrics at a time so you always know exactly how your current performance compares to your targets.
Databox also breaks big monthly goals down automatically into weekly and daily targets, which makes hitting a large goal feel a lot less overwhelming since you know exactly what needs to happen each day.
Goals become even more useful once you connect them with the rest of the platform.
You can assign specific goals to teams or individuals, making it easy to spot who might need extra support before deadlines start slipping.
The mobile app lets you check your progress from your phone, watch, or even a TV screen in the office.
And since goals connect directly with your metrics, dashboards, and reports, you can visualize your progress everywhere you already work instead of managing goals as some separate disconnected task.
6. OKRs
Before Databox, most companies kept their OKRs scattered across slides, spreadsheets, and random docs that nobody updated consistently.
Teams wasted hours manually tracking progress, and it was often hard to tell how daily work actually connected to the bigger strategy.
Databox fixes this by building OKRs directly where your data already lives, pulling automatic progress updates from over 130 integrations so every objective stays current without anyone lifting a finger.
Every goal rolls up cleanly to the company strategy, complete with clear owners and timelines attached.
The structure keeps everyone aligned no matter where they sit in the company.
You can set company wide objectives and link smaller sub-goals underneath them, so every team can see exactly how their daily work supports the bigger picture.
Since goals build directly from your metrics, progress updates itself in real time, saving your team from manually tracking numbers every week.
Notifications keep everyone informed too, flagging whether a goal is on track, at risk, or falling behind, so the right people know where things stand without having to ask around.
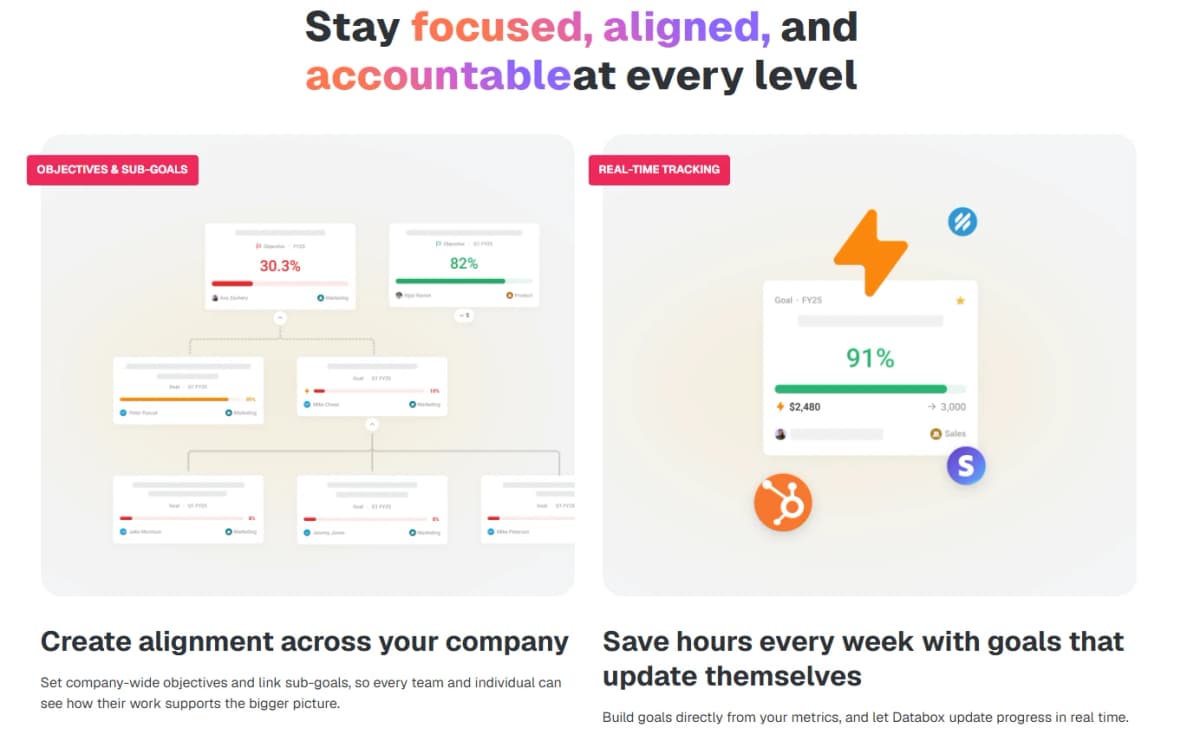
Accountability gets built right into the system. Every goal gets assigned to a specific person or team, so responsibility never becomes a mystery.
You can also publish your company's mission and vision alongside your objectives, giving teams the why behind the work instead of just a list of targets to hit.
Each objective comes with an end date too, keeping everyone focused on what needs to happen within a given cycle.
If you want a quick overview, you can switch between a detailed list view or a strategy map that shows how everything connects at a glance, and every objective has its own page loaded with progress, owners, and notes so nobody has to chase down updates through endless messages.
What really sets this feature apart is how it connects strategy to actual performance data instead of stopping at planning.
Since Databox pulls real time data from over 130 tools, your OKRs always reflect what is actually happening rather than outdated numbers someone typed in manually.
Every team member can get access without worrying about extra seat costs, which makes company wide alignment realistic instead of expensive.
And because objectives, goals, and metrics all live in one platform, nobody has to bounce between five different tools just to figure out whether the company is actually on track.
7. Data Preparation
Raw data is messy by nature, and most business intelligence tools expect you to already know how to clean it up before you can even start analyzing.
Databox takes a different approach with its Data Preparation feature, built for fast moving teams instead of trained BI experts.
You can standardize, merge, and filter your data into one clean table without touching a line of code, which means your team can start trusting the numbers instead of second guessing them.
The core of this feature runs through Datasets. You can pull exact data from spreadsheets, databases, or any of your connected tools and shape it into a single clean table using a simple no-code interface. Once your data is pulled in, filtering lets you narrow everything down to just what matters, so your analysis stays focused instead of drowning in irrelevant rows. If you need the full picture, you can merge datasets from multiple sources into one table, letting you compare row level data side by side without needing an actual BI specialist on staff.
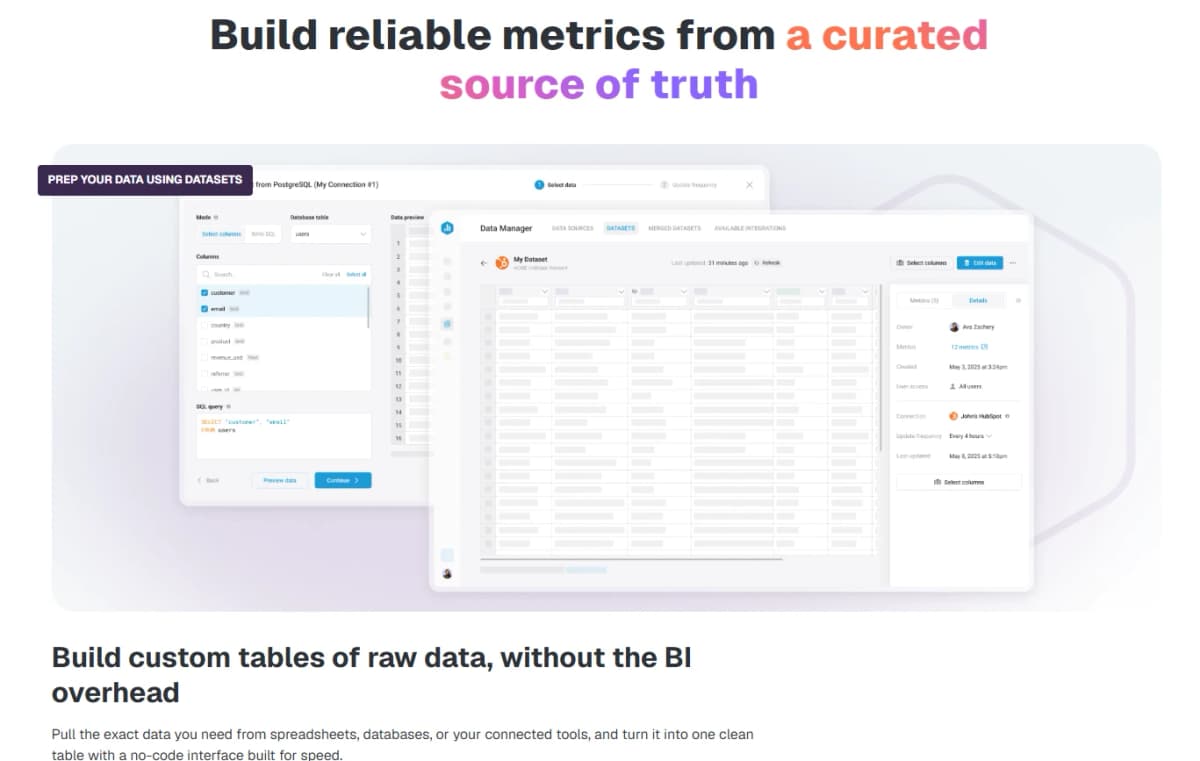
Building custom columns adds another layer of flexibility here. You can calculate new columns by combining existing ones, then turn that new column into a fully custom metric down the line.
Once your data is prepped the way you want, exporting it as a CSV file means you are not stuck using it only inside Databox.
You can take that clean data anywhere else your team already works.
Customizing columns rounds things out nicely too, since you can rename fields, change data types, or hide anything irrelevant, making your final numbers easier to understand for clients, executives, or anyone else looking at the report.
Once you prepare your data a single time, you can use it everywhere across the platform.
That same clean dataset can power your dashboards, feed into reports, track your goals, and even support forecasts, so you are never rebuilding the same table from scratch every time you need it for something new.
8. MCPs
AI tools are impressive, but they do not actually know anything about your business unless you give them access to real numbers.
Without that context, your AI is basically guessing at answers dressed up to sound confident.
Databox MCP solves this by connecting directly to tools like Claude, ChatGPT, n8n, and Cursor, letting your AI pull from your actual performance data instead of making things up.
The trust factor here matters a lot. Every metric gets defined, joined, and calculated inside Databox before your AI tool ever sees it, which eliminates the mismatched definitions that usually make AI generated numbers unreliable.
You also get visual answers directly inside the conversation, so instead of reading a wall of text you can see charts and context right alongside the explanation.
This setup means anyone on your team can get real answers in plain language without needing to build a dashboard, write code, or interrupt your data analyst for something simple.
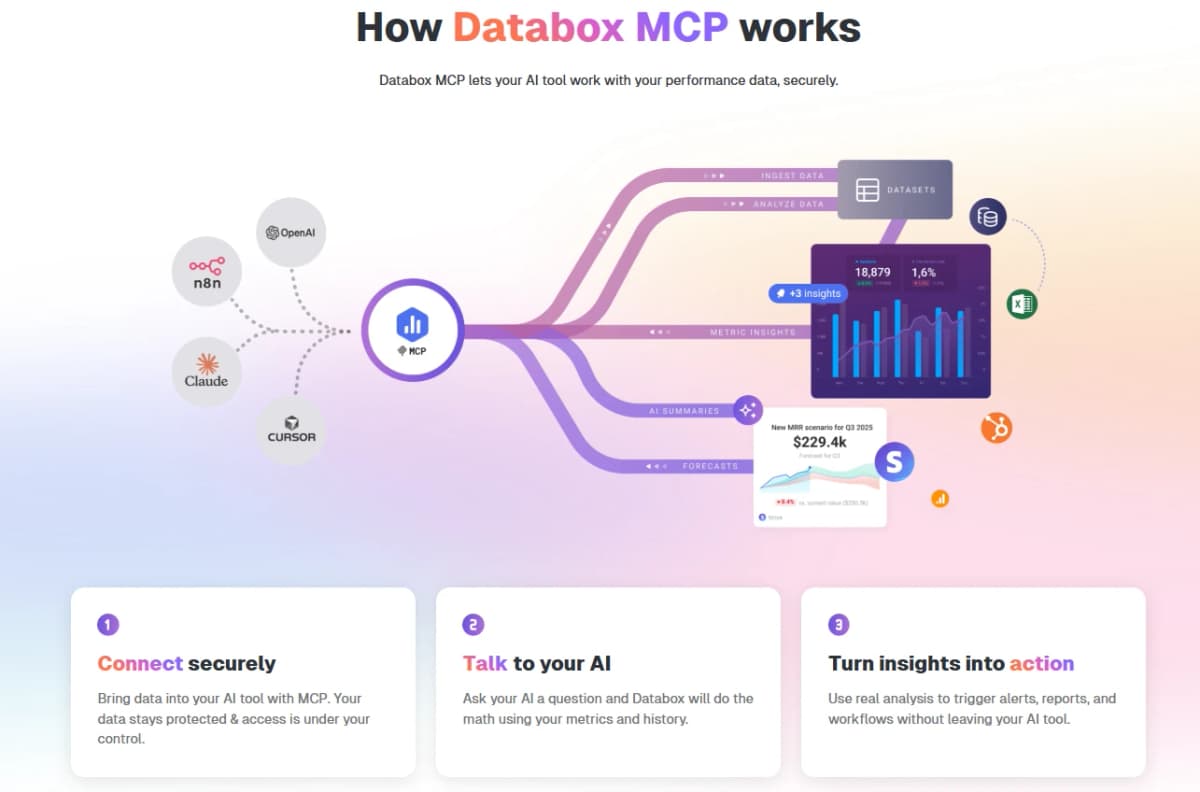
Getting started takes just three steps. First you connect securely, bringing your data into whatever AI tool you already use while keeping full control over access permissions.
Next you simply talk to your AI like you normally would, asking a question and letting Databox handle the actual math behind the scenes using your real metrics and history.
From there you can turn those insights into action, triggering alerts, generating reports, or kicking off workflows without ever leaving your AI tool.
The functionality splits into three useful categories. Analyze lets you ask direct questions about revenue trends, user behavior, or campaign performance and get explanations backed by real charts instead of raw numbers alone.
Ingest lets you push new data straight into Databox from your AI tool, so you can upload a messy CSV and have it cleaned and standardized automatically, or pull data straight from an API without writing a pipeline yourself.
Automate takes things a step further by turning your insights into recurring actions, scheduling AI powered reports, triggering alerts when key metrics shift, and generating executive summaries complete with context.
Setting the whole thing up takes about sixty seconds regardless of which AI client you use, since Databox works through one simple endpoint compatible with any MCP client.
9. Integrations
None of these features matter much if Databox cannot actually reach your data in the first place, and this is where the platform really delivers.
You get access to over 130 native integrations covering marketing, sales, finance, and support tools, so your data starts syncing almost immediately after you connect an account.
Whatever tool your team already relies on, chances are Databox already talks to it directly.
Beyond the standard integrations, Databox also connects to databases and warehouses through a no-code solution, which means pulling data from something like PostgreSQL, Snowflake, or Google BigQuery does not require a dedicated engineer.
If your team still relies on spreadsheets, Databox integrates smoothly with Google Sheets and Excel too, along with automation tools like Zapier and Make for teams that already have workflows built around those platforms.
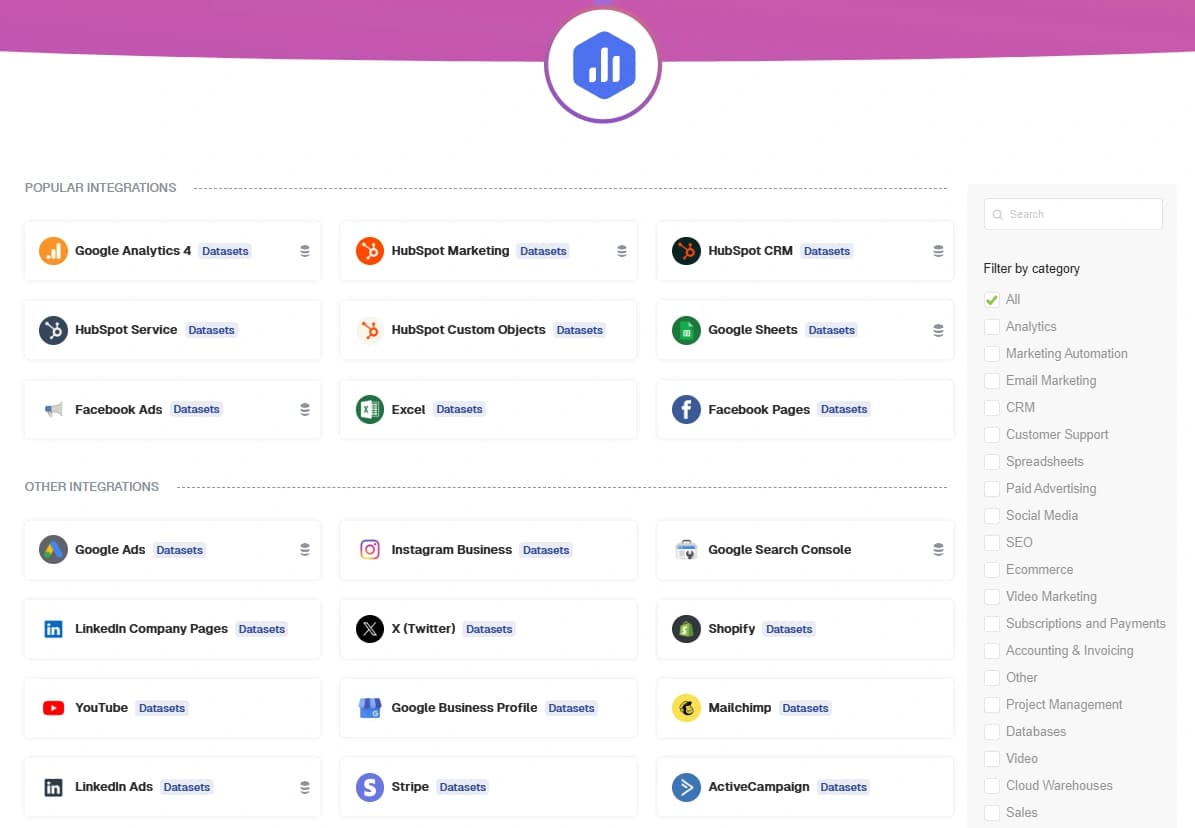
The integration list itself covers pretty much everything a growing business needs.
On the marketing and sales side you get HubSpot, Google Ads, Facebook Ads, LinkedIn Ads, Shopify, and Salesforce, among plenty of others.
Finance teams get QuickBooks and Stripe for tracking revenue and cash flow.
And if you are working with a tool that is not on the native list, Databox lets you build a custom integration by connecting to any application through its API, with no coding required on your end.
For teams with more specific needs, Databox also supports direct API access, letting you push raw structured data into the platform from literally anywhere.
Once that data lands inside Databox, you can immediately start building dashboards, generating reports, and pulling insights from it just like any other connected source.
Between the native integrations, the no-code database connections, and the open API access, there is a real chance your entire tech stack can plug into Databox without leaving major gaps.
Databox Pricing Plans
Databox keeps pricing simple with a free trial and five different tiers built for businesses at every stage.
You can start with a 14 day free trial of the Growth plan, and if you decide to switch afterward, there is a plan that fits almost any budget.
Paying annually also saves you 20 percent compared to paying monthly, so it is worth considering if you plan on sticking around.
The Free plan costs nothing and gives you three data sources, one user, and 50 AI credits every month.
You still get cloud integrations and limited BI features, though Datasets, the MCP server, and sharing options stay locked. It works fine if you just want to test the waters.
Right above that sits the Analyst plan at $64 a month when billed annually.
It bumps you up to five data sources and 500 AI credits, and unlocks full integrations, BI features, Datasets, and the MCP server, though sharing and notifications are still off the table.
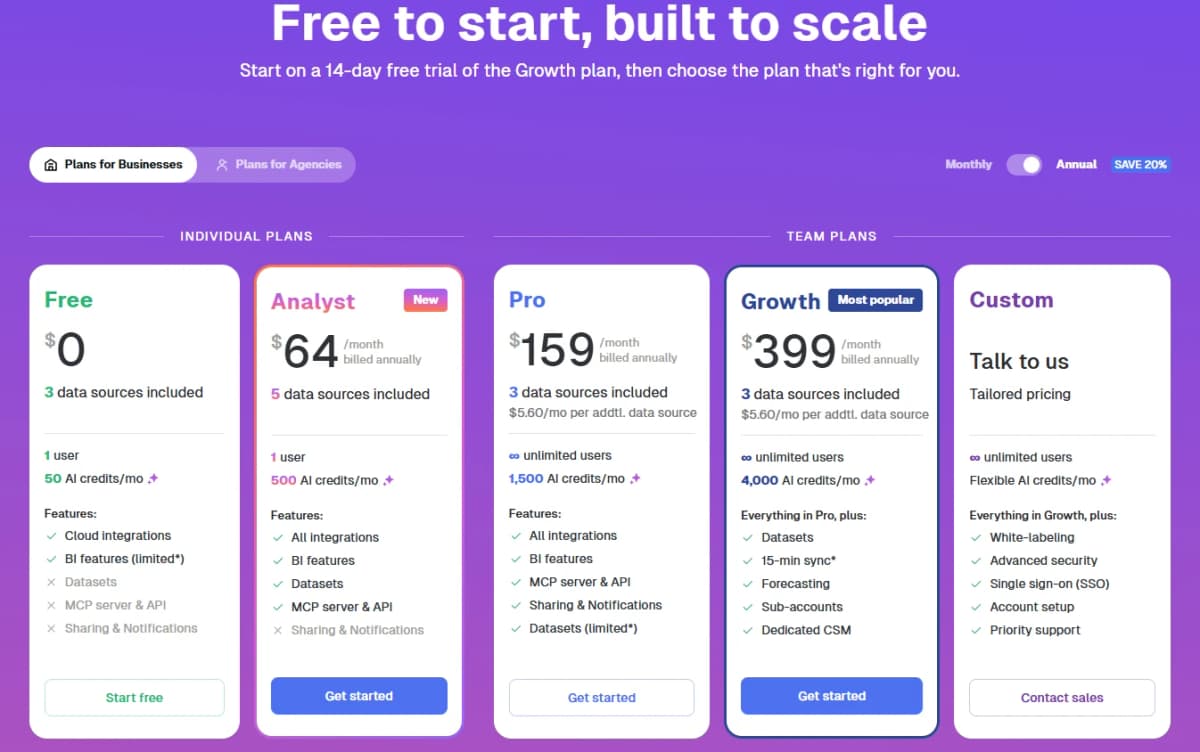
The Pro plan runs $159 a month billed annually and starts opening things up for teams.
You get unlimited users, 1,500 AI credits, and everything from the Analyst tier, plus sharing and notifications along with limited Datasets access.
If your team needs more firepower, the Growth plan at $399 a month billed annually adds full Datasets, faster 15 minute syncing, forecasting, sub-accounts, and a dedicated customer success manager.
It also comes with unlimited users and 4,000 AI credits a month, making it the most popular option among growing teams.
For companies with bigger needs, Databox offers a Custom plan with tailored pricing built around your specific requirements.
This tier includes everything in Growth plus white labeling, advanced security, single sign-on, dedicated account setup, and priority support.
You would need to talk directly with their sales team to get exact numbers, but it is clearly built for larger operations that need more flexibility than the standard tiers offer.
Agencies get their own separate pricing structure, and it makes sense since agencies usually manage several client accounts instead of just one internal team.
Just like the business plans, agencies can start with the same 14 day free trial of the Growth tier before committing to anything.
Agency Starter kicks things off at $79 a month billed annually. It includes three data sources, five client accounts, and unlimited users, along with 500 AI credits every month.
You get cloud integrations, limited BI features, the MCP server, and sharing and notifications right out of the gate, though Datasets remain out of reach at this tier.
Moving up to Agency Pro at $159 a month billed annually removes the client account limit entirely, giving you unlimited client accounts and unlimited users.
You also get 1,500 AI credits, full BI features, and limited Datasets access.
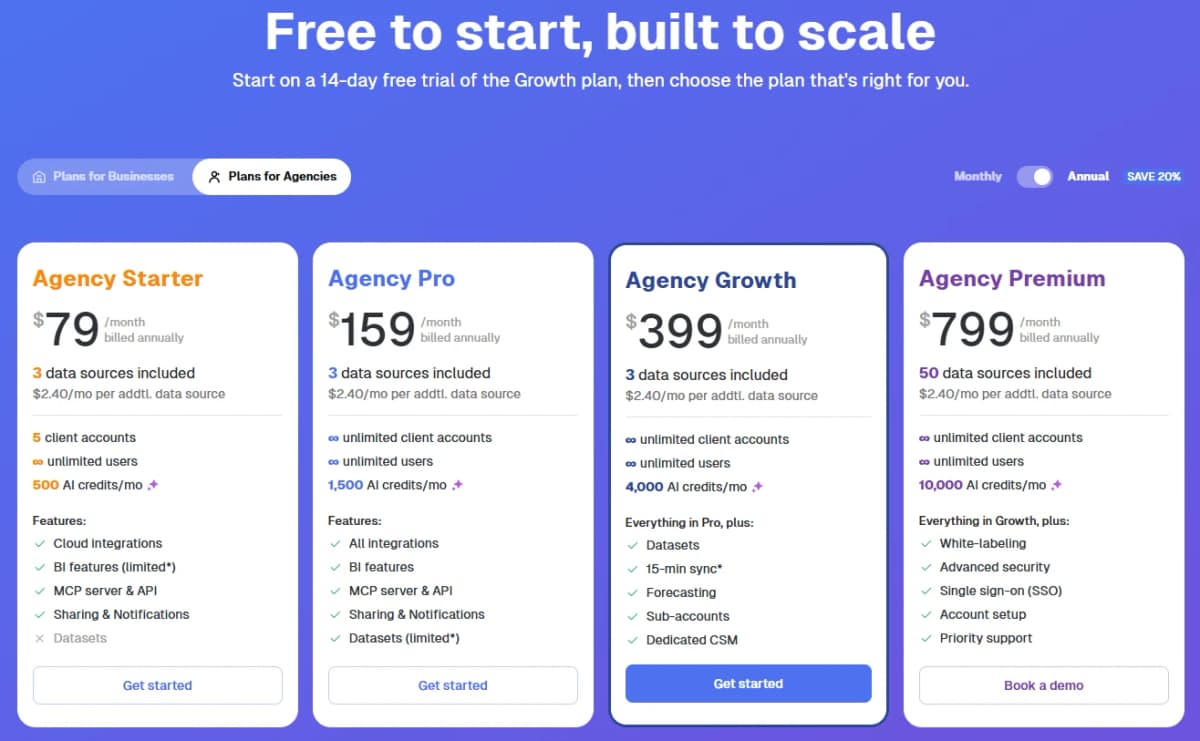
Agency Growth costs $399 a month billed annually and matches the business Growth plan in terms of power.
You get everything from Agency Pro plus full Datasets, 15 minute syncing, forecasting, sub-accounts, and a dedicated customer success manager, all while keeping unlimited client accounts and users.
This tier also bumps your AI credits up to 4,000 a month, giving agencies plenty of room to run AI powered analysis across multiple clients without running out of credits halfway through the month.
At the very top sits Agency Premium, priced at $799 a month billed annually.
This plan includes 50 data sources right out of the box along with 10,000 AI credits a month, which is a massive jump from the other tiers.
You get everything from Agency Growth plus white labeling, advanced security, single sign-on, account setup help, and priority support.
If your agency is managing a large roster of clients and needs the platform to feel like your own branded product, this tier is clearly built with that goal in mind.
Databox Solutions
1. For SaaS
Running a SaaS business means juggling data from marketing, sales, customer success, product, and finance, and keeping all of it straight can eat up your whole week.
Databox solves this by pulling everything into one place, connecting to over 130 data sources so every team works from the same live numbers instead of five different spreadsheets that never quite match up.
Consistency is where things really start paying off.
When marketing reports one MRR number and finance reports another, meetings turn into arguments instead of actual decisions getting made.
Databox fixes this by letting you define each metric once and use that same definition across every dashboard, report, and AI generated answer.
Once your definitions are locked in, building dashboards becomes simple too.
You can drag and drop the metrics that matter most, organize everything around what your team actually needs, and share it with anyone inside or outside your company without writing a single line of code.
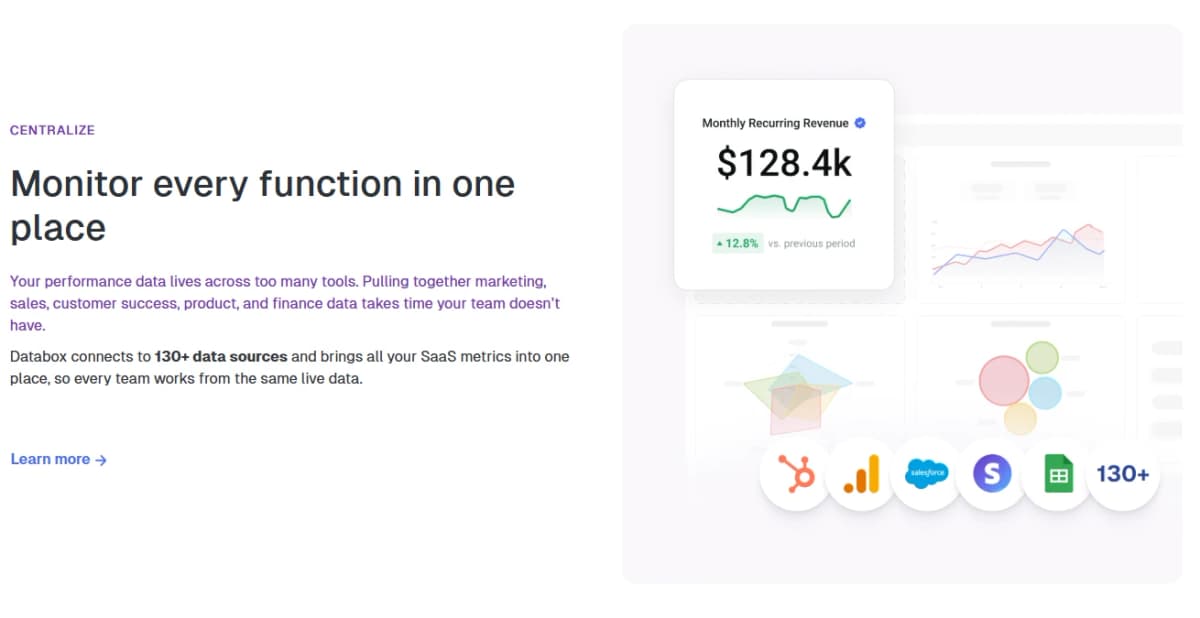
Getting answers fast matters even more when something goes wrong. If pipeline drops or churn spikes, your team should not have to wait around for an analyst to explain what happened.
You can ask Genie a plain language question and get an answer immediately, backed by the same metrics and definitions your whole team already trusts.
Reporting gets automated too, so instead of manually building the same board update every month, you can schedule reports to send automatically and share live dashboards straight in Slack, keeping leadership in the loop without extra effort from your team.
Planning ahead rounds out the whole system nicely.
You can set goals on any metric, connect team objectives back to company targets, and forecast where performance is heading before problems show up.
Alerts notify you the moment something needs attention, giving your team time to adjust course instead of discovering a missed target after it is too late.
And since Databox offers pre-built dashboard templates for SaaS metrics, you can connect your tools and start tracking performance within just a few clicks.
2. For Agencies and Consultants
Agencies live and die by client reporting, but spending hours every month copying data into slides takes time away from actually advising clients.
Databox tackles this by centralizing every client's performance data in one place, keeping dashboards and reports automatically updated using live data pulled from over 130 integrations.
That alone saves account managers from the repetitive copy paste work that eats up entire afternoons.
Onboarding new clients gets a lot easier too.
Instead of rebuilding your reporting setup from scratch every time, or relying on the one person who understands how everything works, you can create branded report templates once and roll them out across every client account.
This gives every account manager on your team a consistent way to deliver polished white label reports without reinventing the wheel each time.
When you need to actually understand what is happening with a client, you can connect Databox directly to Claude or ChatGPT and ask questions about their performance in plain language, getting answers grounded in real data instead of needing a senior strategist involved every single time.
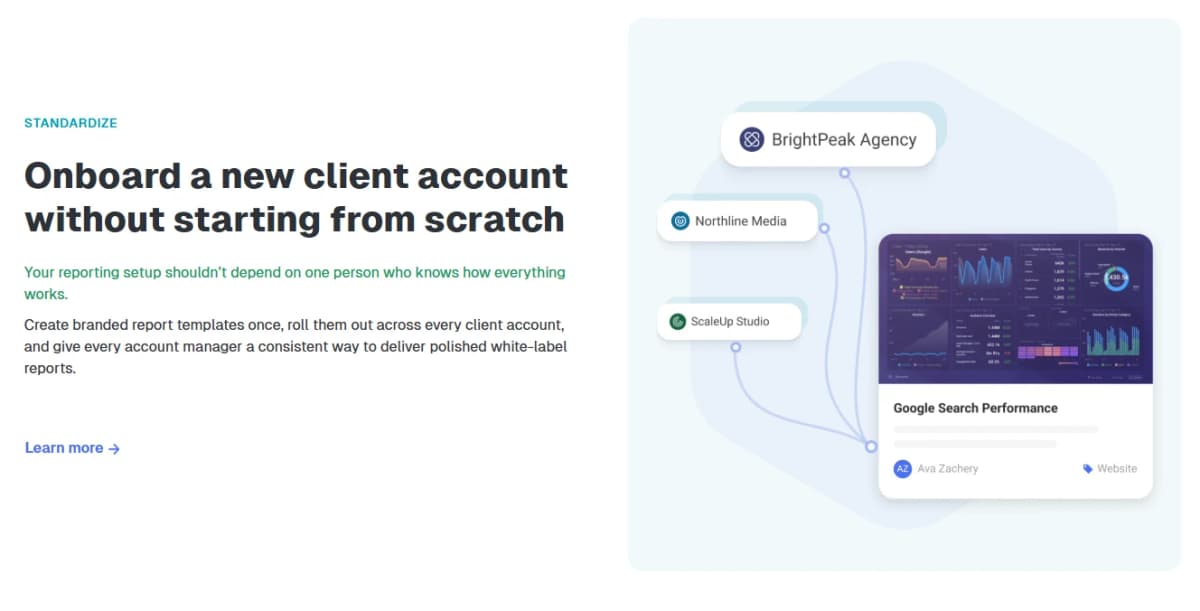
Delivery gets automated as well, which matters a lot when you are managing dozens of client relationships at once.
Branded reports go out automatically on whatever schedule your clients expect, and you can embed live dashboards directly into client portals so they always see current numbers.
For agencies running the same analysis across many accounts, you can set up workflows and AI skills that monitor performance continuously, flagging changes and routing recommended actions straight to Slack or your project management tools.
Databox also runs a Solutions Partner program worth mentioning here.
Agencies can resell the platform to clients and earn a 30 percent recurring revenue share on every subscription sold.
This gives you a way to build a new revenue stream without adding more billable hours, positioning your agency as offering BI as a service rather than just standard reporting.
It also helps you retain your best clients longer, since the relationship becomes anchored around ongoing performance instead of a one time project that eventually wraps up.
3. For Functional Leaders
Leading a team means proving your impact, and that gets a lot harder when your data lives scattered across a dozen different tools.
Before using Databox, most functional leaders spend hours pulling reports manually, struggle to keep their team aligned with company wide priorities, and find it genuinely hard to show executives what their team actually accomplished.
Databox flips this around by letting you track your team's KPIs in one place without needing a single spreadsheet, align your goals directly with company strategy, and report results to leadership with actual confidence.
Getting your data centralized is the first step. Databox connects to over 130 popular tools spanning sales, marketing, finance, and operations, while also pulling in custom data from spreadsheets like Google Sheets or Excel.
You can even visualize backend data straight from SQL databases without writing any code yourself.
Once your data lives in one place, Datasets let you standardize your team's KPIs so everyone works from identical definitions, and you can drill down into row level data to see exactly what is driving any specific number.
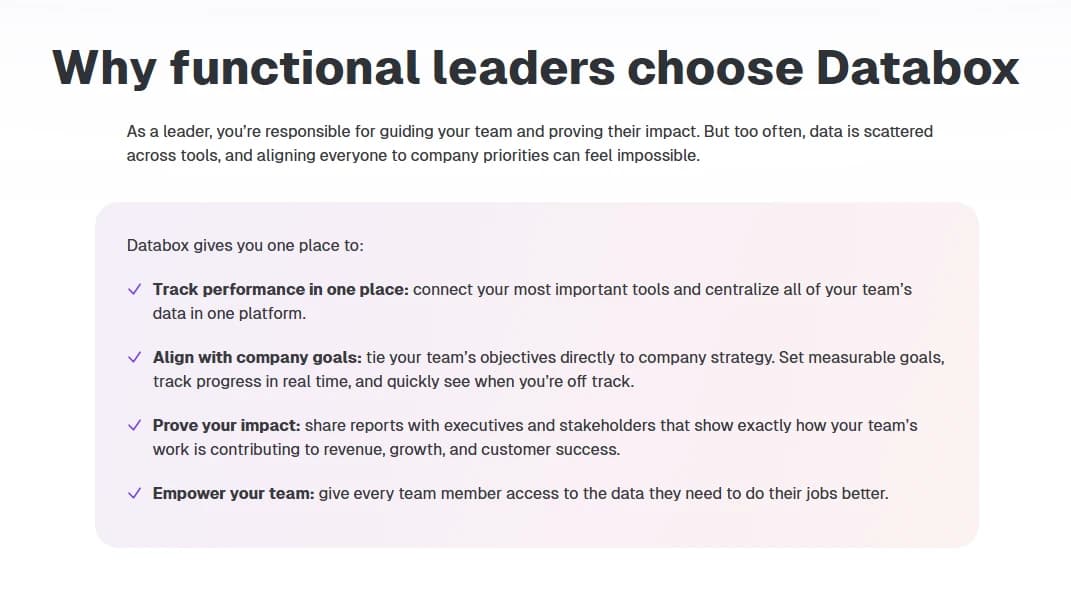
Tracking the right metrics becomes simple from there.
You get access to hundreds of pre-built metrics across your connected tools, plus the option to build custom metrics that reflect your team's specific definitions, including calculated ones like ROI or conversion rate.
Dashboards give you real time visibility into performance through an intuitive drag and drop builder, letting you spot trends early and adjust strategy before small issues turn into real problems.
When it comes time to report upward, you can build executive ready reports in minutes, complete with AI generated summaries that help explain results to leadership without you writing everything from scratch.
Accountability tools finish off the picture. You can set clear performance targets for your team or individuals, watch progress through color coded indicators, and get notified the moment something starts slipping so you can course correct early.
Notifications keep everyone aligned by sending alerts to Slack, email, or mobile devices whenever a KPI spikes or dips unexpectedly.
Databox also gives your team a dedicated space to share dashboards and reports, encouraging self-service access so people are not constantly pinging you for updates.
Between centralized data, aligned goals, and reports that actually prove your impact, functional leaders get a system built specifically around the pressure of leading a team while staying accountable to the business above them.
4. For Executives
Running a company means making high stakes decisions constantly, but that gets a lot harder when your data lives scattered across a dozen tools and spreadsheets.
Before Databox, most executives spend their time waiting on analysts for answers they need right now, watching teams make decisions without any real alignment to company goals, and losing valuable hours just switching between tabs to stay informed.
Databox flips this entirely by letting you see revenue, pipeline, churn, and every other key KPI in one single place, keeping your whole company aligned around the same shared metrics and goals.
Getting there starts with centralizing your data. Databox connects to over 130 popular tools across sales, marketing, finance, and operations, while also pulling in custom data from spreadsheets like Google Sheets or Excel.
You can even visualize backend SQL data without writing a single line of code yourself.
Once everything lives in one place, dashboards give you a real time view of company performance, letting you monitor revenue, churn, and pipeline together while exploring trends through filters, comparisons, and metric drilldowns.
You can even stream a live dashboard straight to an office TV, keeping performance visible without anyone having to ask for an update.
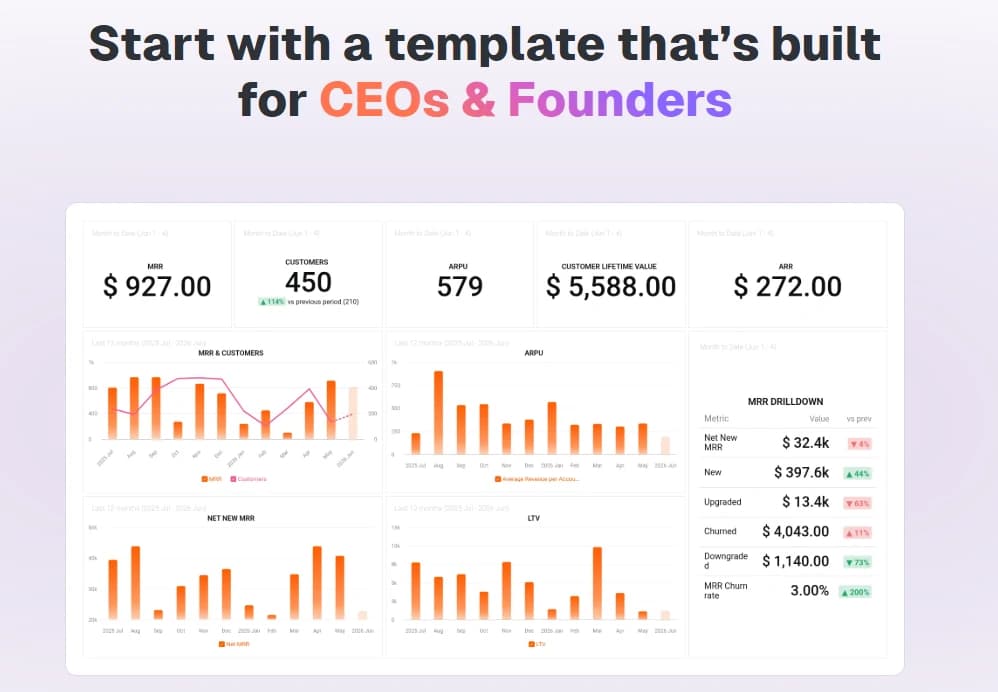
Reporting to your board and investors gets a lot less stressful too. You can build polished, comprehensive reports in minutes, and let AI explain what changed and what to do about it.
Reports can go out ahead of time as a PDF or live link, or you can present them directly in presentation mode during a meeting.
Setting goals rounds out the planning side of things, letting you define performance targets for any metric across teams, watch progress through color coded charts, and get alerted the moment something drifts off track so you can step in before it becomes an actual problem.
Staying informed becomes almost effortless from here.
Notifications alert you the moment revenue drops or churn spikes, and you can choose to receive them through email, Slack, or mobile push depending on what works best for you.
The Teams feature organizes dashboards by department, so you can see exactly how each part of the business contributes to overall goals without chasing anyone down for a status update.
And since Databox comes with a mobile app, you can check dashboards, get push notifications, and track goals no matter where you happen to be standing.
Between real time visibility, clear accountability, and faster decision making, Databox gives executives a genuine shortcut past the usual bottlenecks that slow leadership down.
5. For Business Analysts
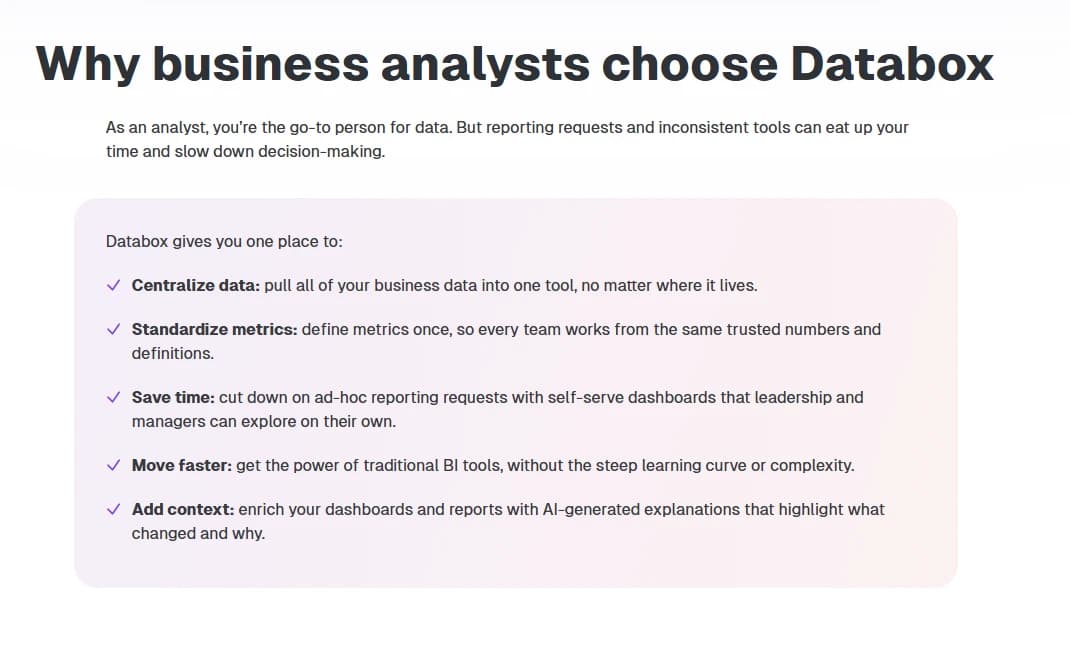
Being the go-to data person at your company sounds important, but it usually means spending hours building reports on request while teams depend on you for even the simplest answers.
Before Databox, keeping data consistent and trustworthy across the whole company feels like a constant uphill battle.
Databox changes that by letting you connect every tool your company uses, build the metrics your business actually needs, and empower teams to self-serve their own dashboards and reports instead of waiting on you for everything.
Centralizing data is the natural starting point.
You can connect to over 130 popular tools spanning sales, marketing, finance, and operations, pull in custom data from spreadsheets like Google Sheets or Excel, and visualize backend SQL data without writing any code.
From there, Datasets let you prepare your data properly for deeper analysis.
You can build a curated table of raw data from one or several sources, apply filters, change field types, and create new calculated columns, then drill down to row level detail to see exactly what is driving any given number.
This gives you a source of truth that the rest of the company can actually trust.
Once your data foundation is solid, building out metrics becomes straightforward.
You can apply filters, segments, and dimensions to save the exact version of a metric your team needs, combine data across multiple sources to build things like conversion rate or ROAS, and pull from hundreds of ready to use metrics already available from your connected tools.
Dashboards take this even further by combining data from multiple tools into one trusted view, letting leaders and managers self-serve insights anytime instead of submitting a request and waiting around for you to build something new.
Reports automate leadership updates too, replacing manual spreadsheets and slide decks with board ready updates that include historical comparisons and AI written context.
Forecasting adds another layer of value here. You can model future performance for any KPI, including revenue, pipeline, or churn, while factoring in seasonality and holidays for more accurate predictions.
The Teams feature lets you create dedicated spaces organized by department or project, giving every team the specific metrics, dashboards, and reports relevant to their work.
Between centralized data, standardized metrics, and dashboards that let people help themselves, Databox takes a huge chunk of repetitive reporting work off your plate, freeing you up to focus on the kind of analysis that actually moves the business forward instead of answering the same question five different ways every week.
Final Thoughts On Databox
Databox brings together everything a growing business needs to actually understand its own numbers.
From Genie handling your questions in plain language to dashboards, reports, goals, and OKRs keeping every team aligned, the platform covers a lot of ground without forcing you to learn complicated BI tools.
Add in over 130 integrations, a solid data preparation system, and MCP support for connecting straight to your favorite AI tool, and you get a platform built for speed instead of spreadsheets.
If you are on the fence about which plan to pick, the Analyst plan is a smart place to start.
At $64 a month billed annually, you get five data sources, 500 AI credits, full integrations, BI features, Datasets, and MCP server access, all for a price that will not scare off a small team or a solo operator.
It gives you enough room to actually test what Databox can do without committing to a bigger tier before you know if it fits your workflow.
Once your data needs grow, upgrading to Pro or Growth is simple, but the Analyst plan is the sweet spot for anyone who wants real functionality without overspending out of the gate.
Businesses drowning in scattered spreadsheets and mismatched numbers finally have a place to bring everything together.
Give the Analyst plan a shot and see how much time you get back once your data stops living in ten different places.
Databox FAQ
1. What is Databox?
Databox is a business analytics platform that centralizes your data into dashboards, reports, goals, and AI powered insights.
2. Who is Genie in Databox?
Genie is Databox's AI analyst that builds metrics, dashboards, and explains performance changes in plain language.
3. How many integrations does Databox support?
Databox connects to over 130 native integrations across marketing, sales, finance, and support tools.
4. Can I build metrics without knowing SQL?
Yes, Databox includes a no-code SQL builder for creating custom metrics from database sources.
5. Does Databox offer a free plan?
Yes, the Free plan includes three data sources, one user, and 50 AI credits a month.
6. What does the Analyst plan include?
The Analyst plan costs $64 a month billed annually and includes five data sources, 500 AI credits, full integrations, BI features, Datasets, and MCP access.
7. How do Databox protect privacy and ensure security?
Databox is SOC 2 certified and uses trusted hosting infrastructure, security controls, and compliance practices designed to protect customer data.
8. Which payment methods does Databox accept?
You can pay for your Databox subscription using Visa, Mastercard, Maestro, American Express, JCB, Discover, Diners Club, UnionPay, and Google Pay.
9. What is Databox MCP?
Databox MCP lets you connect Databox to AI tools like Claude, ChatGPT, n8n, or Cursor to chat with your data directly.
10. Can I stream dashboards to a TV?
Yes, Databox lets you stream dashboards to a TV for real time performance display.
11. Do I need a credit card to start a trial?
No. You can start your 14-day free trial without entering payment details.
12. Can I white label dashboards and reports?
Yes, white labeling is available starting on the Growth plan for businesses and higher tiers for agencies.
13. Does Databox offer report automation?
Yes, you can schedule PDF reports to send automatically through email or Slack.
14. What are Databox Datasets?
Datasets let you standardize, merge, and filter raw data into clean tables for reliable metric building.
15. Can I forecast future performance in Databox?
Yes, the Forecast feature lets you model future performance for KPIs like revenue, pipeline, or churn.
16. Does Databox support OKRs?
Yes, Databox includes OKR tracking that connects company objectives to real time performance data.
17. Is there a free trial available?
Yes, Databox offers a 14 day free trial of the Growth plan.
18. Can Databox replace or complement tools like Looker Studio, Power BI, or Tableau?
Yes. If you don't have a BI tool today, Databox replaces the spreadsheets, screenshots, and one-off dashboards you've been stitching together.
19. Can I export data prepared in Databox?
Yes, you can export prepared data as a CSV file for use in other tools.
20. Can I add more data sources without upgrading?
Yes. On Pro, Growth, and Custom plans, you can add data sources to your plan at any time for $5.60 per source per month on annual billing.