Affiliate Conversion Rate Benchmarks For Blogs: From Click To Sale
You put a link in a post, a few readers click it, and then you wait. Weeks later you open the report and wonder if one sale from fifty clicks is good or bad.
That question has a real answer, but it is not a single number. A normal affiliate conversion rate depends on what you sell, who clicks, and where they came from.
The seven steps below cover how the funnel works, where to find honest benchmarks, how to measure your own numbers, and how to fix the weakest spot. A worked example and a list of common mistakes follow.
Treat every benchmark as a rough guide and never as a grade. Your own trend over time tells you far more than any average.
Disclosure: Some of the links I share might be affiliate links. If you click on one and make a purchase, I may earn a small commission as a thank you. But don’t worry, it won’t cost you anything extra. I only recommend stuff I genuinely believe in. Your support helps me keep creating awesome content. You can read my full affiliate disclosure in my disclaimer page.
If you want to save a lot of hours searching for high-paying affiliate programs, check out our exclusive list of 2500+ affiliate programs. You’ll find all the information about the programs inside the list. This list is perfect for affiliate bloggers and influencers.
Why A Normal Affiliate Conversion Rate Is Hard To Pin Down
Search for the average and you will see numbers from under 1% to above 5%. They come from real data, but they measure different things.
One report counts every visitor to an online store. Another counts only people who clicked an affiliate link, and a third counts the paying customers of a software product.
Different starting points give different answers. A fair comparison needs the same start and the same finish.
Your blog adds more variation. A post that ranks for a buying phrase sends readers who are ready to act, while a how-to post sends readers who want to learn.
Price matters as well. A ten dollar item is easy to buy on impulse, and a two thousand dollar item can take weeks of thinking.
The offer matters too. A well known brand with a smooth checkout turns more clicks into sales than an unknown shop with a slow site.
Traffic source changes the picture again. Someone who searched Google for a product name acts differently from someone who scrolled past your pin on Pinterest.
So the goal is not to hit a magic number. The goal is to learn your own funnel, find a fair comparison, and improve the weakest step.
Think of a benchmark as a weather forecast before a trip. It helps you pack, but you still have to look outside.
Our guide to affiliate dashboard metrics explains the other numbers in your reports. Here we stay on the path from click to sale.
Keep one rule in mind as you read. Quote a number only with its source, and treat any figure without a source as a guess.
Bloggers sometimes skip this step and jump to tips. That leads to fixing a problem that does not exist, like rewriting a post when the real trouble is the merchant's checkout.
A clear funnel also keeps you calm. When a number drops, you can ask which stage moved instead of guessing.
Step 1: Define The Funnel From Impression To Sale
Before you compare anything, name each stage of the funnel. A blogger's path has five moments: a page view, a click on your link, a visit to the merchant, a purchase, and a paid commission.
Impressions come first. For a blog post, an impression is a search result or a pin that someone saw, and a page view is a reader who opened the post.
Click-through rate on your links is the second stage. It is the share of readers who click an affiliate link after they open the page.
Merchant conversion rate is the third stage. It is the share of people who land on the merchant's site and then buy.
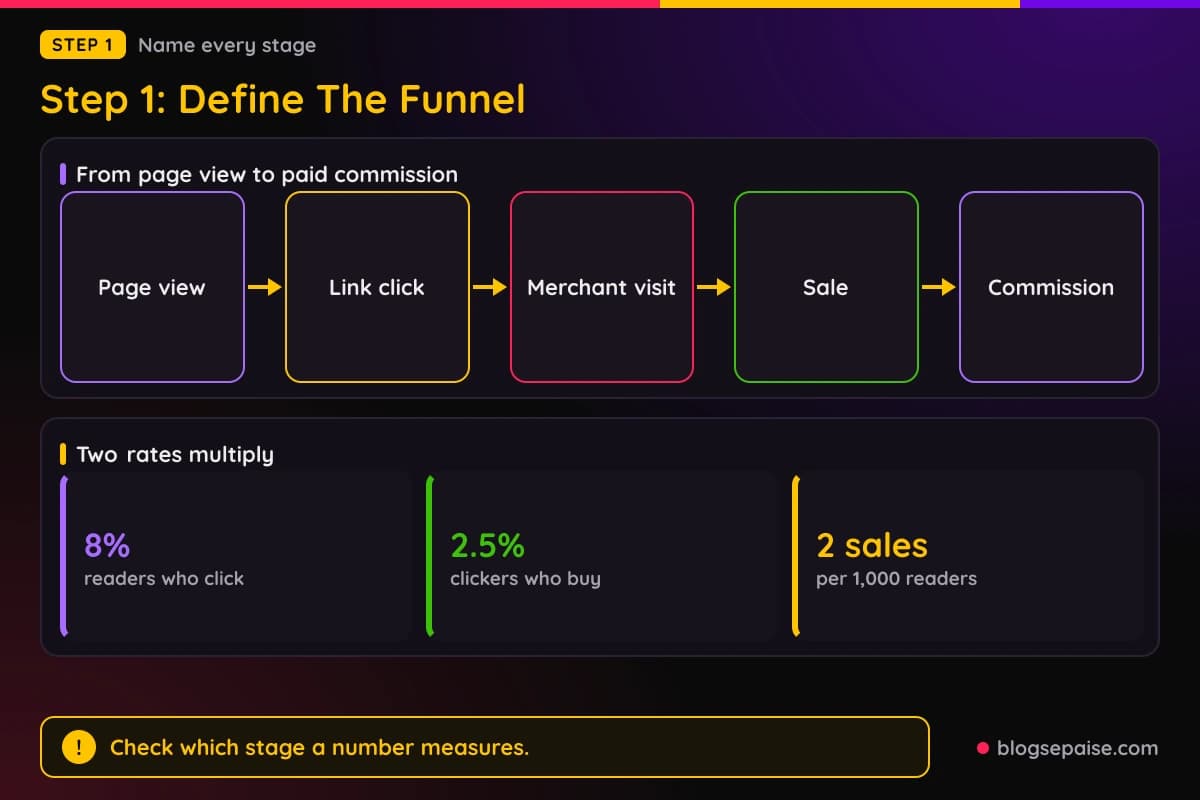
Those two rates multiply. If 8% of readers click and 2.5% of those clickers buy, then 2 sales come from every 1,000 readers.
Most people who say affiliate conversion rate mean the second rate: sales divided by clicks. Some tools divide sales by page views instead, so always check the definition.
Amazon defines conversion in its Associates Central glossary as dispatched items divided by clicks. Its example is 200 clicks that led to 18 dispatched items, which gives 9%.
Amazon adds that items ordered often exceed items dispatched, because some orders are canceled before dispatch. So the same week can show two slightly different results.
Earnings per click, or EPC, is the fourth idea. Divide your commission income by your clicks, and you see what each click is worth.
EPC blends conversion rate, price, and commission rate into one number. A low conversion rate on a pricey product can still beat a high conversion rate on a cheap one.
Revenue per 1,000 visits is the fifth number. It shows how much a page earns for the traffic it gets, which helps when you compare posts.
Write the five numbers on a sheet for each key post. Those are page views, link clicks, sales, commission, and the dates they cover.
Keep the date range the same for every stage. Sales that happen weeks after a click can make a short window look worse than it is.
With the funnel named, you know what a benchmark claims to measure. The next step is finding one that fits your situation.
Step 2: Find A Benchmark That Matches Your Situation
Benchmarks come in three groups: store conversion rates, affiliate network averages, and program reports from software companies. Each answers a different question.
Start with store conversion rates. Littledata, a Shopify analytics company, shows a median Shopify conversion rate of 1.4% across 436 stores for the 90 days ending October 24, 2026.
Littledata also shows that the top 20% of stores convert above 2.7%, and the top 10% reach 3.7% or higher. So a store at 1.4% is typical, and a store at 3.7% is excellent.
Device changes the number too. Contentsquare's 2026 report, as cited by Shopify, puts desktop conversion at 3.4% and mobile at 2%, while mobile makes up about 70% of ecommerce traffic.
Many blogs get most of their readers on phones, so a mobile heavy blog may land nearer the lower figure. Check your own device split before you pick a target.
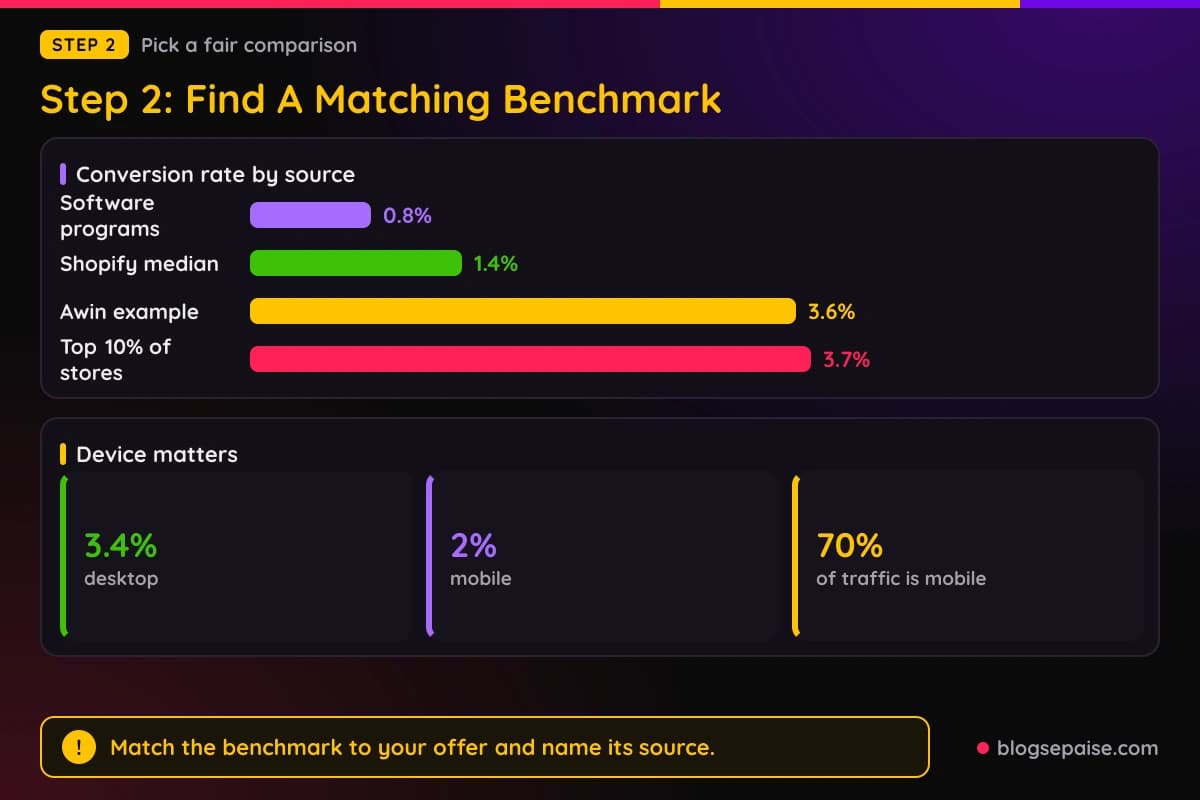
Network averages come next. Awin gives an average conversion rate of 3.6% as an example in its advice for advertisers.
Software programs look different. Rewardful's State of SaaS Affiliate Programs report, published in March 2026, shows an average referral-to-sale conversion rate of 0.8% over 90 days.
Roughly 8 of every 1,000 referred visitors become paying customers there. Software often involves trials and longer decisions, which can pull the rate down.
Rewardful's report also shows that 1.28% of affiliates generate at least one sale. On that platform, fewer than 2 in 100 affiliates make a sale, so a first sale is a real milestone.
Notice how far apart the figures sit: 0.8%, 1.4%, and 3.6%. Different stores, different products, and different counting rules explain the gap.
Several affiliate blogs claim a typical range of 1% to 3% without naming a source. Treat that range as folk wisdom and not as data.
A fair working range for product links, using the store figures above, is roughly 1% to 4%. Software links can run lower, and the range is only a starting guess until you have your own numbers.
Pick the benchmark closest to your offer: store data for products, program data for software. Then write down its source and date next to it.
Write down what each number means before you trust it, since one tool may count clicks the moment a reader taps and another may wait for a page to load.
Step 3: Measure Your Own Numbers
Your own data beats any average, and you probably have most of it already. Start with the report inside each affiliate network.
Most networks show clicks, orders, and commission by link or by date. Amazon Associates Central, for example, reports clicks, ordered items, shipped items, and conversion, and you can view results by tracking ID.
A tracking ID is a label you attach to your links so the report can split results. Make one for each site or traffic type, and the report does the sorting for you.
Other networks call the same idea a sub ID or a click reference. Awin links carry a clickref value at the end, and many programs offer a field like it.
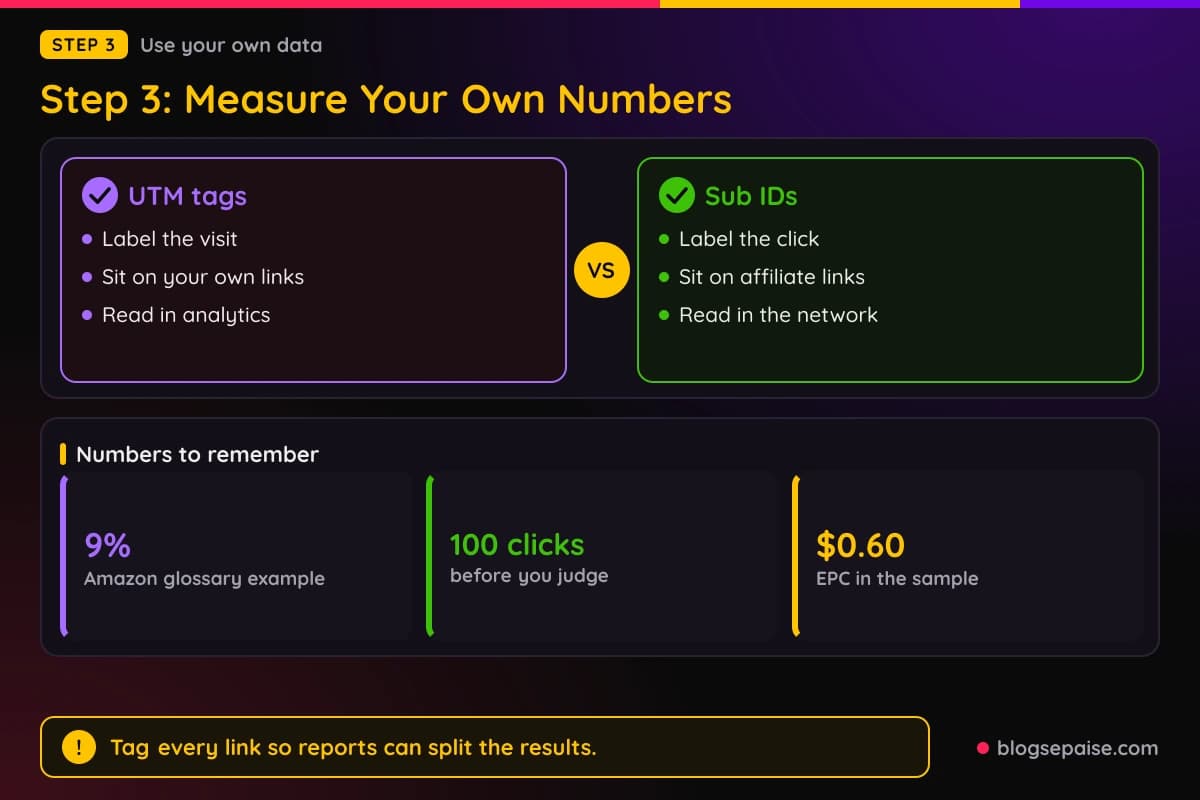
UTM tags are the second tool. They label visits in your analytics, so you see which source and campaign sent each reader to your page.
Use our UTM parameter builder to create tagged links for emails, pins, and social posts. Then read the results in Google Analytics once you finish the Google Analytics setup.
UTM tags and sub IDs do different jobs. UTM tags describe the visit to your blog, and sub IDs describe the click that left your blog.
Link tracking tools tie the two together. ClickMagick tracks clicks on your links and splits results by source, and our link tracking software guide compares more options.
WordPress plugins help with link management. Pretty Links and ThirstyAffiliates turn long affiliate URLs into short links on your own domain, and they count clicks.
Lasso is another plugin that adds product display boxes and click reports. A clean display box can also lift your link click-through rate.
Pull four numbers for each key post: page views, link clicks, sales, and commission. Use the same dates for all four.
Then do the math. Link click-through rate equals clicks divided by page views, conversion rate equals sales divided by clicks, and EPC equals commission divided by clicks.
Here is a small sample. Say a link gets 100 clicks, 3 sales, and $60 in commission, which gives a conversion rate of 3% and an EPC of $0.60.
Collect enough clicks before you judge. A page with 20 clicks and 1 sale shows 5%, but one sale more or less swings the rate wildly.
As a rough habit, wait for at least 100 clicks before you trust a rate. That is a rule of thumb and not a law of statistics.
Also note the delay between click and sale. Programs with cookie windows credit later purchases to the click, so the most recent days often look incomplete.
Do this setup once and the rest of the process gets easier. Each report then takes a few minutes instead of an evening.
If your network shows only a total, ask support if sub IDs are available. Many programs have them even when the dashboard hides the option.
Step 4: Segment By Page And Source
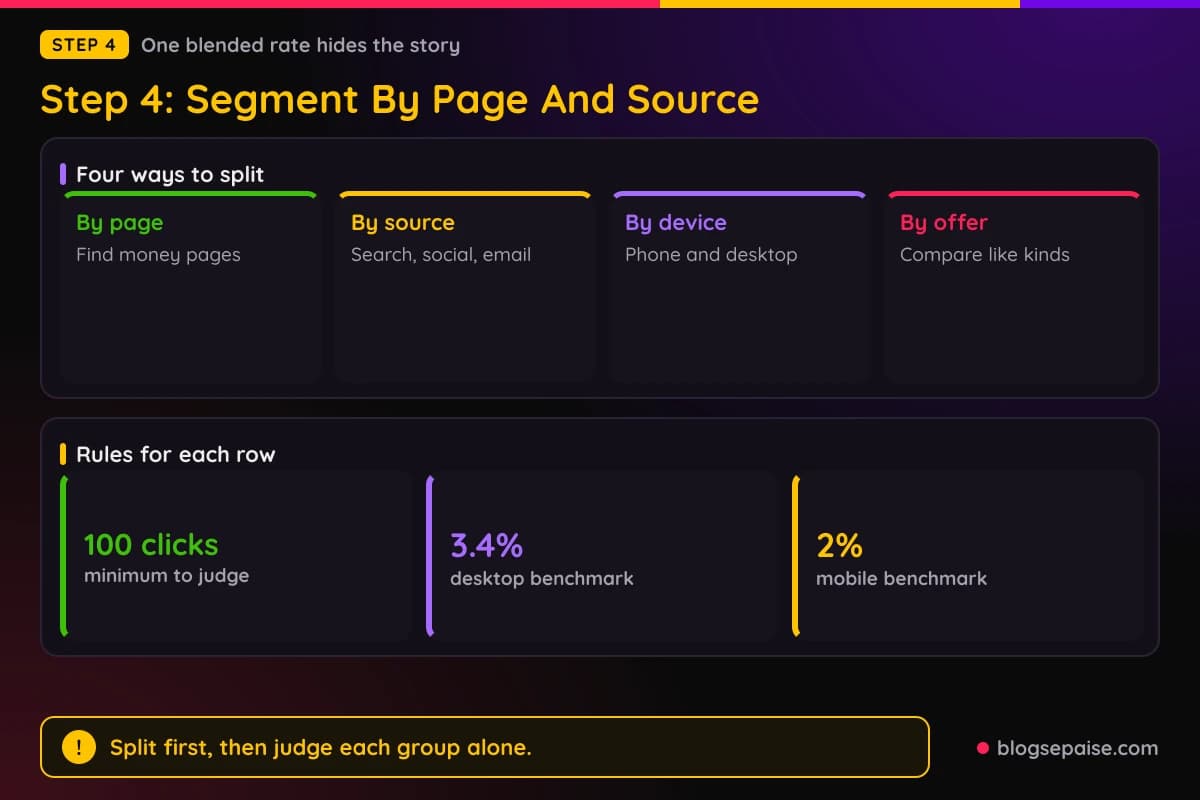
One blended rate hides the story. Your blog has strong pages and weak pages, and averaging them gives a number that describes none of them.
Split your results by page first. List each post that has affiliate links and give it its own clicks, sales, and EPC.
You will often find two or three pages that bring most of the money. Those are your money pages, and they deserve the most care.
Then split by traffic source. Search, social, email, and referral visitors behave differently, and each group needs its own rate.
Readers who search for a product name or a phrase like best laptop for students are shopping. They tend to click more and buy more than readers from a casual social post.
Social readers often come to browse. They click and may save the page for later, so their conversion rate can look weak even when the post does its job.
Email subscribers know you already. A link in a message to people who trust you can convert well, which is why many bloggers track email as its own source.
Device is a third split. Compare mobile and desktop readers, because the 3.4% desktop and 2% mobile figures from Contentsquare show how large the gap can be.
Next, split by offer. A $15 item and a $300 item will never share a conversion rate, so compare each only with its own kind.
Placement counts too. Track if the link sat in the first paragraph, a product box, a button, or the end of the post.
Build a simple sheet with one row for each page and source. The columns hold page views, clicks, click-through rate, sales, conversion rate, and EPC.
Read our guide on affiliate blog traffic if you want to grow the sources that convert best. More visitors from a weak source rarely fix a weak funnel.
Mark any row with fewer than 100 clicks as too small to judge. Revisit it next month with more data.
Segments also protect you from false alarms. A drop in one source can look like a site-wide problem until you split the data and see that one pin or one email caused it.
Step 5: Compare Honestly With Benchmarks
Now put your numbers next to a benchmark, but compare like with like. A store average is a fair match for a product link, and a software average is a fair match for a software link.
Check the denominator first. If your tool divides sales by page views and the benchmark divides sales by clicks, the two numbers cannot meet.
Check the time window next. Rewardful's 0.8% covers 90 days and Littledata's median covers a 90 day span, while your dashboard may show only last week.
Then check the price. A blog that sells $20 gadgets should expect more sales per click than a blog that sells premium software.
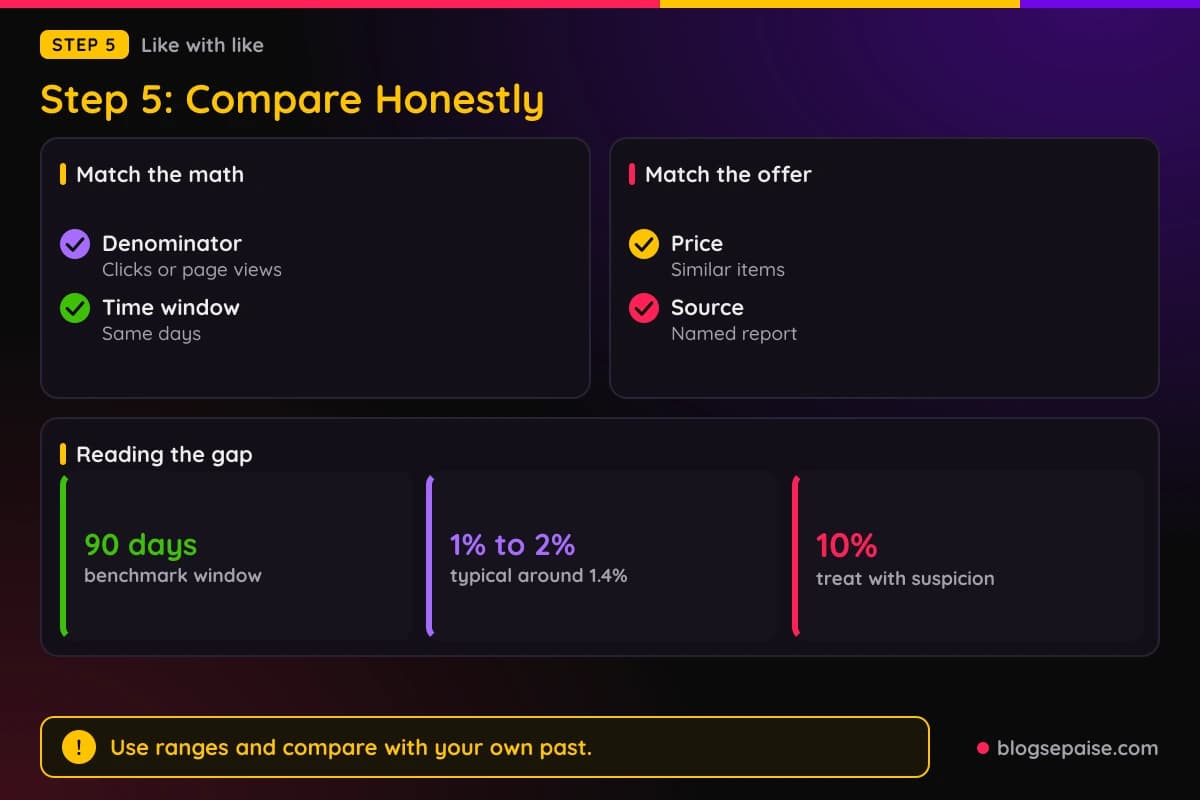
Use ranges and not exact lines. If the benchmark says 1.4% for the median store, treat anything from about 1% to 2% as typical.
A rate below the typical range is a signal to look closer, not a failure. A rate above it is a pleasant surprise that you should test for repeatability.
Be wary of rates above 10%. They usually mean a tiny click count, a tracking quirk, or a definition that counts something other than sales.
Compare yourself with your past too. Last quarter's rate on the same page is the most honest benchmark you have.
Compare EPC as well, because a low rate on a big commission can win. An EPC of $0.90 beats an EPC of $0.40 no matter which page had the higher percentage.
Do not compare yourself with income screenshots. They show the best case and hide the traffic, the costs, and the years behind it.
Averages mix many merchants, including big brands with polished stores. A new blog that earns a little below the average is normal.
Write one line for each page: our rate is X, and the fair benchmark is Y from source Z. Then decide if the gap is worth fixing.
If the gap is small, move on to another page. Your time is better spent on the biggest leak, which is the next step.
Step 6: Fix The Biggest Leak First
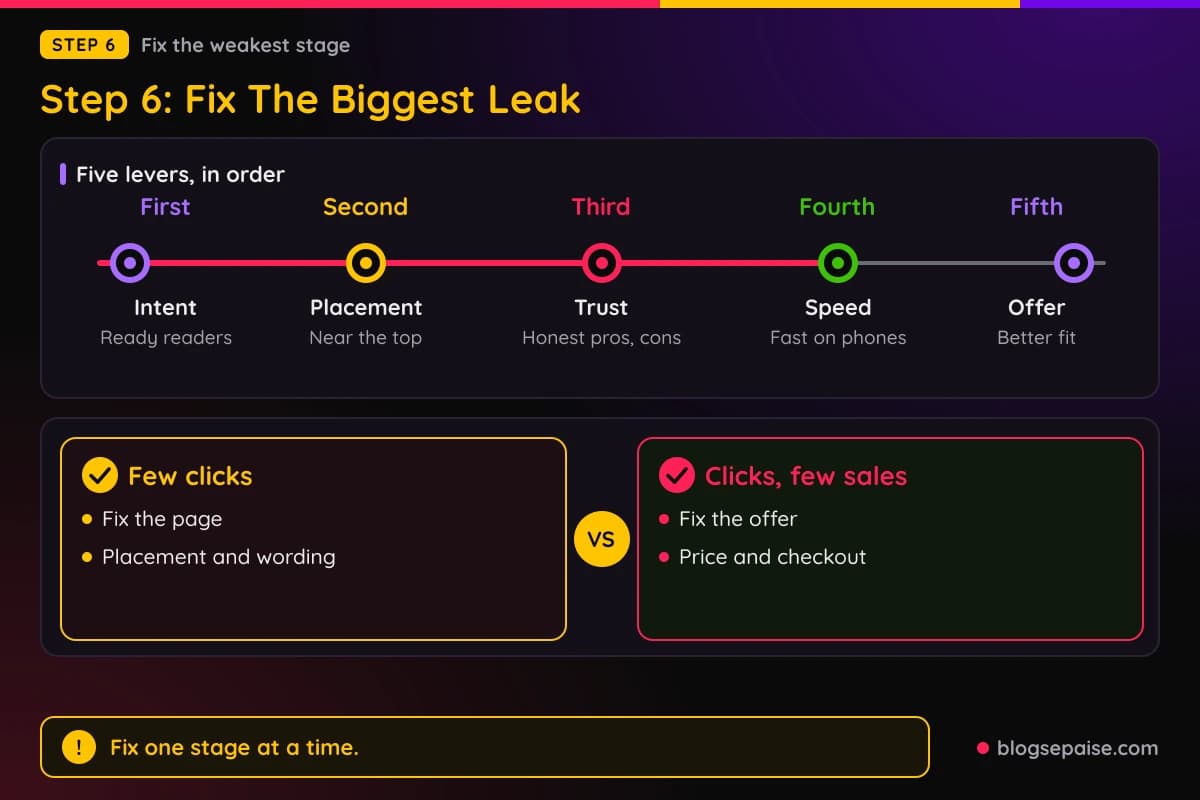
Look at the funnel and find the stage that loses the most. Maybe readers rarely click, maybe clickers rarely buy, or maybe the traffic is the wrong kind.
If clicks are low, the problem sits on your page. Work on placement, wording, and trust before you touch anything else.
If clicks are healthy but sales are low, the problem sits after the click. The offer, the price, the merchant's page, or a mismatch with your promise may be the cause.
If both are low, the traffic may not fit the offer. The post may attract readers who wanted information and not a purchase.
Start with intent match. Put the link in a post whose reader is ready to act, such as a comparison or a best-of guide, and not in a story about your weekend.
Match the product to the question. A reader who searched for budget laptops for students should see budget laptops, not a high end model that earns more.
Placement comes next. Put the first link where readers decide, often near the top, and repeat it in a clear button or box further down.
Awin's conversion tips for advertisers make a similar point about calls to action. Place them above the fold and repeat them further down the page.
Trust is the third lever. Add honest pros and cons, real use details, and a plain disclosure near the link.
Awin's tips also list social proof, such as quality testimonials and reviews. On a blog, the same idea means real reader comments and your own tested results.
Page speed matters because slow pages lose readers before they reach the link. Awin lists fast loading, clean design, and mobile optimization among its tips.
Check your page on a phone. Buttons should be easy to tap, images should not push the link out of view, and pop-ups should not cover it.
Offer fit is the last lever. If a program converts poorly everywhere you use it, swap it for one with a better checkout, a stronger brand, or a longer cookie window.
Our guide on how to find affiliate links helps you track down alternatives. Test one change at a time so you know what worked.
Do not chase a stage that is already good. Raising a healthy click rate from 8% to 9% matters less than fixing a checkout that converts at 0.5%.
Keep notes on every fix you try. Each entry saves you from repeating a test that already failed.
Step 7: Track Changes And Keep A Log
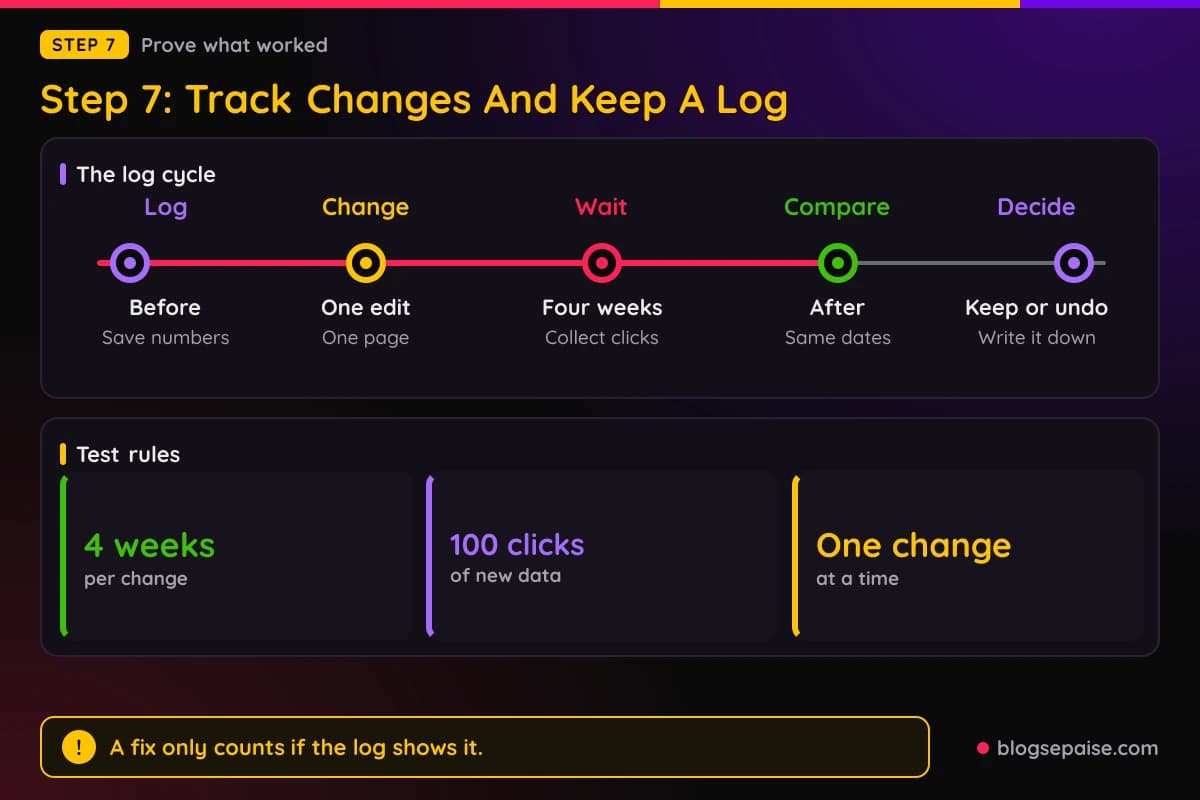
A fix only counts if you can see its effect. Keep a simple log with the date, the page, the change, and the numbers before it.
Change one thing for each page at a time. If you move the link and rewrite the intro in the same week, you will never know which helped.
Give each change at least 4 weeks, or until the page collects 100 or more new clicks. Short tests produce noise.
Compare the same page before and after, using the same date length. Seasonal swings can fake a win, so look at the same weeks from last year if you have them.
Holidays move conversion rates. Retail pages often convert better near big sales and worse in quiet months, so a rise in November may not come from your edit.
Check your numbers on a schedule. A monthly review of top pages and a quarterly look at the whole site is enough for most bloggers.
Use the same sheet each time. Rows hold pages, columns hold the five funnel numbers, and a notes column holds the changes.
Watch for sudden drops. A broken link, an expired offer, or a changed commission rate can wipe out sales overnight, and your tracker is the first place to spot it.
Keep wins and losses. A failed test teaches as much as a success, and you will not repeat it.
Write progress in plain terms. For example, EPC on the laptop page went from $0.60 to $0.80 in two months.
Over time the log becomes your own benchmark library. It shows what a good rate looks like for your readers, your offers, and your niche.
Cheap tests are the best kind. Moving a box or changing a button takes minutes, and the log shows the result within a month.
Avoid big rebuilds until small changes stop helping. A full redesign is hard to measure because so many things shift at once.
A Worked Example: Omar Fixes His Biggest Leak
Omar is a made-up blogger, and the numbers below are invented to show the steps. They are not real results.
He runs a blog about home coffee gear and has one review post with affiliate links. In month one the post gets 5,000 visits.
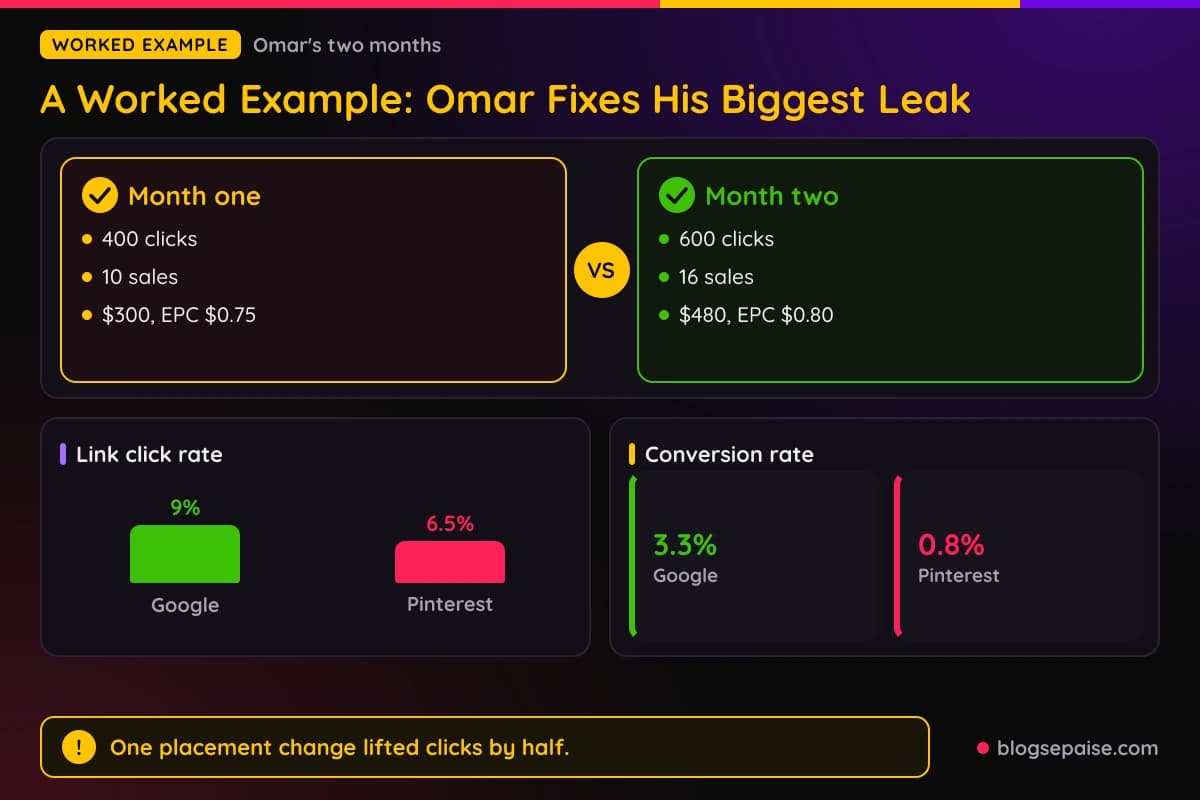
Readers click his links 400 times, so his link click-through rate is 8%. Those clicks lead to 10 sales.
His conversion rate is 10 divided by 400, which is 2.5%. Each sale pays a $30 commission, so he earns $300.
EPC is $300 divided by 400 clicks, or $0.75. He also earns $60 for every 1,000 visits.
Omar compares his 2.5% with the Littledata median of 1.4% and the top 10% mark of 3.7%. He sits in a healthy middle, so conversion after the click is not his main worry.
Next he splits by source. Google brings 3,000 visits, 270 clicks, and 9 sales, which is 3.3% conversion.
Pinterest brings 2,000 visits, 130 clicks, and 1 sale, which is about 0.8%. The two sources add up to the same 400 clicks and 10 sales.
Google readers click at 9%, since 270 of 3,000 visits click. Pinterest readers click at 6.5%, since 130 of 2,000 click.
Omar sees the leak. Google readers buy at a rate above the 2.7% mark for the top 20% of stores, while Pinterest readers click but rarely buy.
He makes one change. He moves a product box with his top pick to the top of the post, where Google readers decide.
Month two brings the same 5,000 visits but 600 clicks, which is a 12% click-through rate. Those clicks lead to 16 sales, a conversion rate of about 2.7%.
Commissions reach $480, and EPC rises to $0.80. Omar logs the change and the dates.
Most of the gain came from more clicks and not from a higher conversion rate. That tells Omar the placement fix worked and the merchant side is fine.
He keeps the box and picks Pinterest as his next test. Small, steady fixes beat big guesses.
The same example also shows a point about patience. Omar needed a full month of clicks before he could trust the change.
He also resisted the urge to fix Pinterest and Google together. Handling one source at a time kept his results clear.
Common Mistakes With Affiliate Conversion Rates
Mixing up definitions is the first mistake. Sales divided by clicks and sales divided by page views are different numbers, and comparing either one to the wrong benchmark gives nonsense.
Trusting numbers with no named source is the second. If a post claims an average with no report behind it, treat it as a guess.
Judging on tiny samples is the third. Ten clicks and one sale show 10%, and that means almost nothing.
Chasing the average is another. Hitting a benchmark does not matter if your EPC is still small.
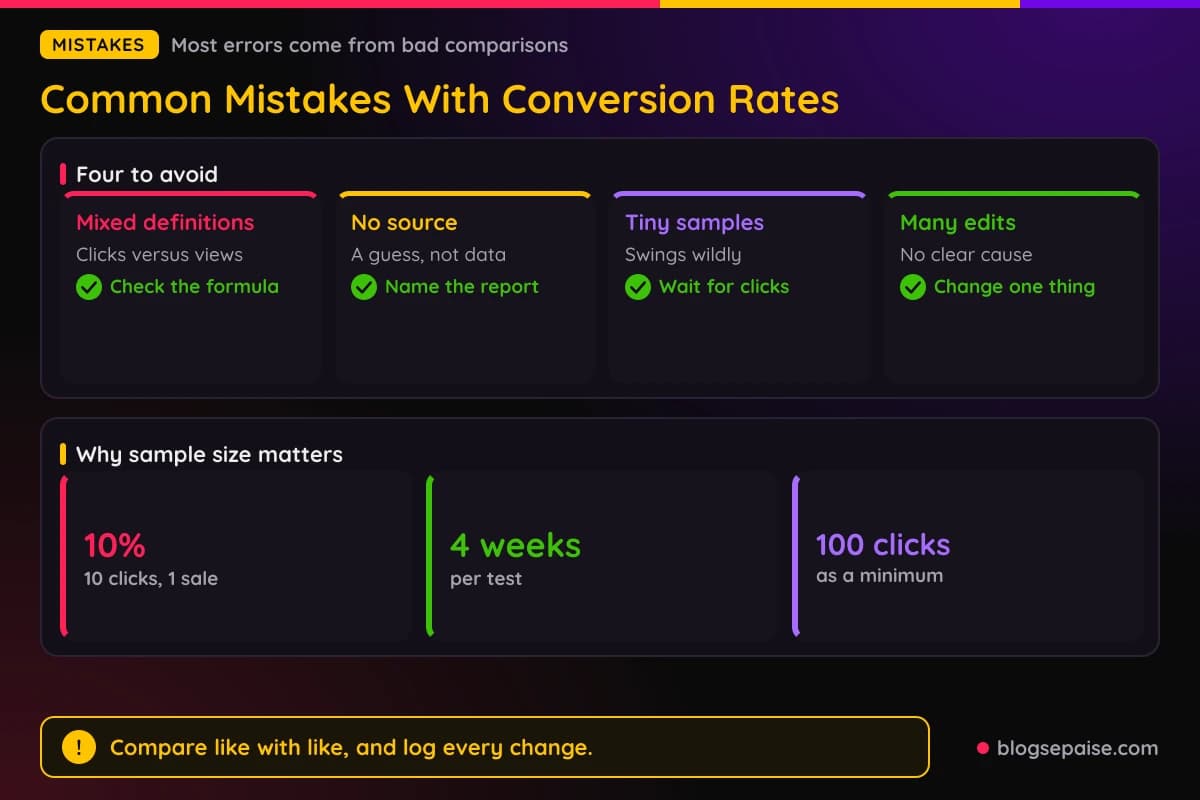
Mixing traffic sources hides problems. Blend Google and Pinterest together and you cannot fix either one.
Changing many things at once ruins the test. Change one thing and wait.
Ignoring price and commission leads to bad choices. A higher conversion rate on a tiny commission can pay less than a lower rate on a big one.
Skipping the disclosure and trust work costs conversions and can break program rules. Readers buy from people they trust.
Forgetting the click-to-sale delay makes new data look bad. Give sales time to arrive before you panic.
Stuffing a page with links lowers the value of each one. Readers who face ten buttons often click none.
Copying income screenshots sets unfair targets. Build your targets from your own log.
Giving up after one weak month is the last mistake. Rates move slowly, and steady testing is how blogs improve.
Build the habit once and it pays off with every new post. You will know what to expect from a page before it earns its first dollar.
Final Thoughts
A normal affiliate conversion rate has no single answer. Littledata shows a Shopify median of 1.4%, Awin gives 3.6% as an example, and Rewardful reports 0.8% for software programs.
Use those as a loose frame, then build your own numbers from clicks and sales. Split them by page and source, and fix the weakest stage first.
Keep a log so you can see what works. Over a few months, your own rate will teach you more than any report.
Start today with one money page. Pull its views, clicks, and sales, and write down click-through rate, conversion rate, and EPC.
Then change one thing and check back in four weeks.
Frequently Asked Questions
1. What is a good affiliate conversion rate?
It depends on the offer. A rough range for product links is 1% to 4%, based on store data such as Littledata's 1.4% median and 3.7% top 10% mark, and software programs often run lower.
2. What is the average conversion rate for Amazon Associates?
Amazon does not publish an average in its glossary. It defines conversion as dispatched items divided by clicks and gives a 9% example, which is an illustration and not a benchmark.
3. How do I calculate my affiliate conversion rate?
Divide sales by clicks and multiply by 100. For 3 sales from 100 clicks, the rate is 3%.
4. What is earnings per click?
EPC is your commission income divided by your clicks. It shows what each click is worth, so it is useful for comparing pages and programs.
5. What is a good click-through rate for affiliate links?
We found no reliable public figure for blog links, so compare your own pages over time. Omar's 8% and 12% in the example are invented numbers.
6. Why is my conversion rate low?
The cause usually sits in one of five places: intent match, placement, trust, page speed, or offer fit. Find the stage that loses the most readers and fix that first.
7. How many clicks do I need before I trust a rate?
Aim for at least 100 clicks. That is a rule of thumb, and more clicks always give a steadier picture.
8. Can I put UTM tags on affiliate links?
UTM tags work best on links that point to your own pages. For the affiliate link itself, use the sub ID, click reference, or tracking ID that your network gives you.
9. Is conversion rate the same as commission rate?
No. Conversion rate is the share of clicks that become sales, and commission rate is the share of the sale price you earn.
10. Does traffic source change conversion?
Yes. Search readers who look for a product tend to buy more than casual social readers, so track each source on its own.
11. How long should I test a change?
Give it 4 weeks or 100 new clicks, whichever takes longer. Shorter tests are mostly noise.
12. Do mobile readers convert worse?
Contentsquare's 2026 report, as cited by Shopify, shows 2% for mobile and 3.4% for desktop. Check your own split before you decide.
13. Which tools track affiliate clicks?
Network reports track clicks by tracking ID or sub ID, and link tools such as ClickMagick, Pretty Links, ThirstyAffiliates, and Lasso add more detail. Our link tracking software guide has a longer comparison.
14. Why do my click counts differ between tools?
Tools count at different points and with different rules. Pick one source of truth for each decision and stay with it.
15. Is a higher conversion rate always better?
No. A high rate on a cheap item with a tiny commission can earn less than a lower rate on a pricey item, so check EPC too.